Audit Overview
The Audit Overview page provides a centralized view of all audit events across the ThetaSecure platform. It aggregates data from every audit category — Identity, Authentication, Access, Notifications, and System — into a single dashboard.
Navigate to Audit → Overview from the sidebar.
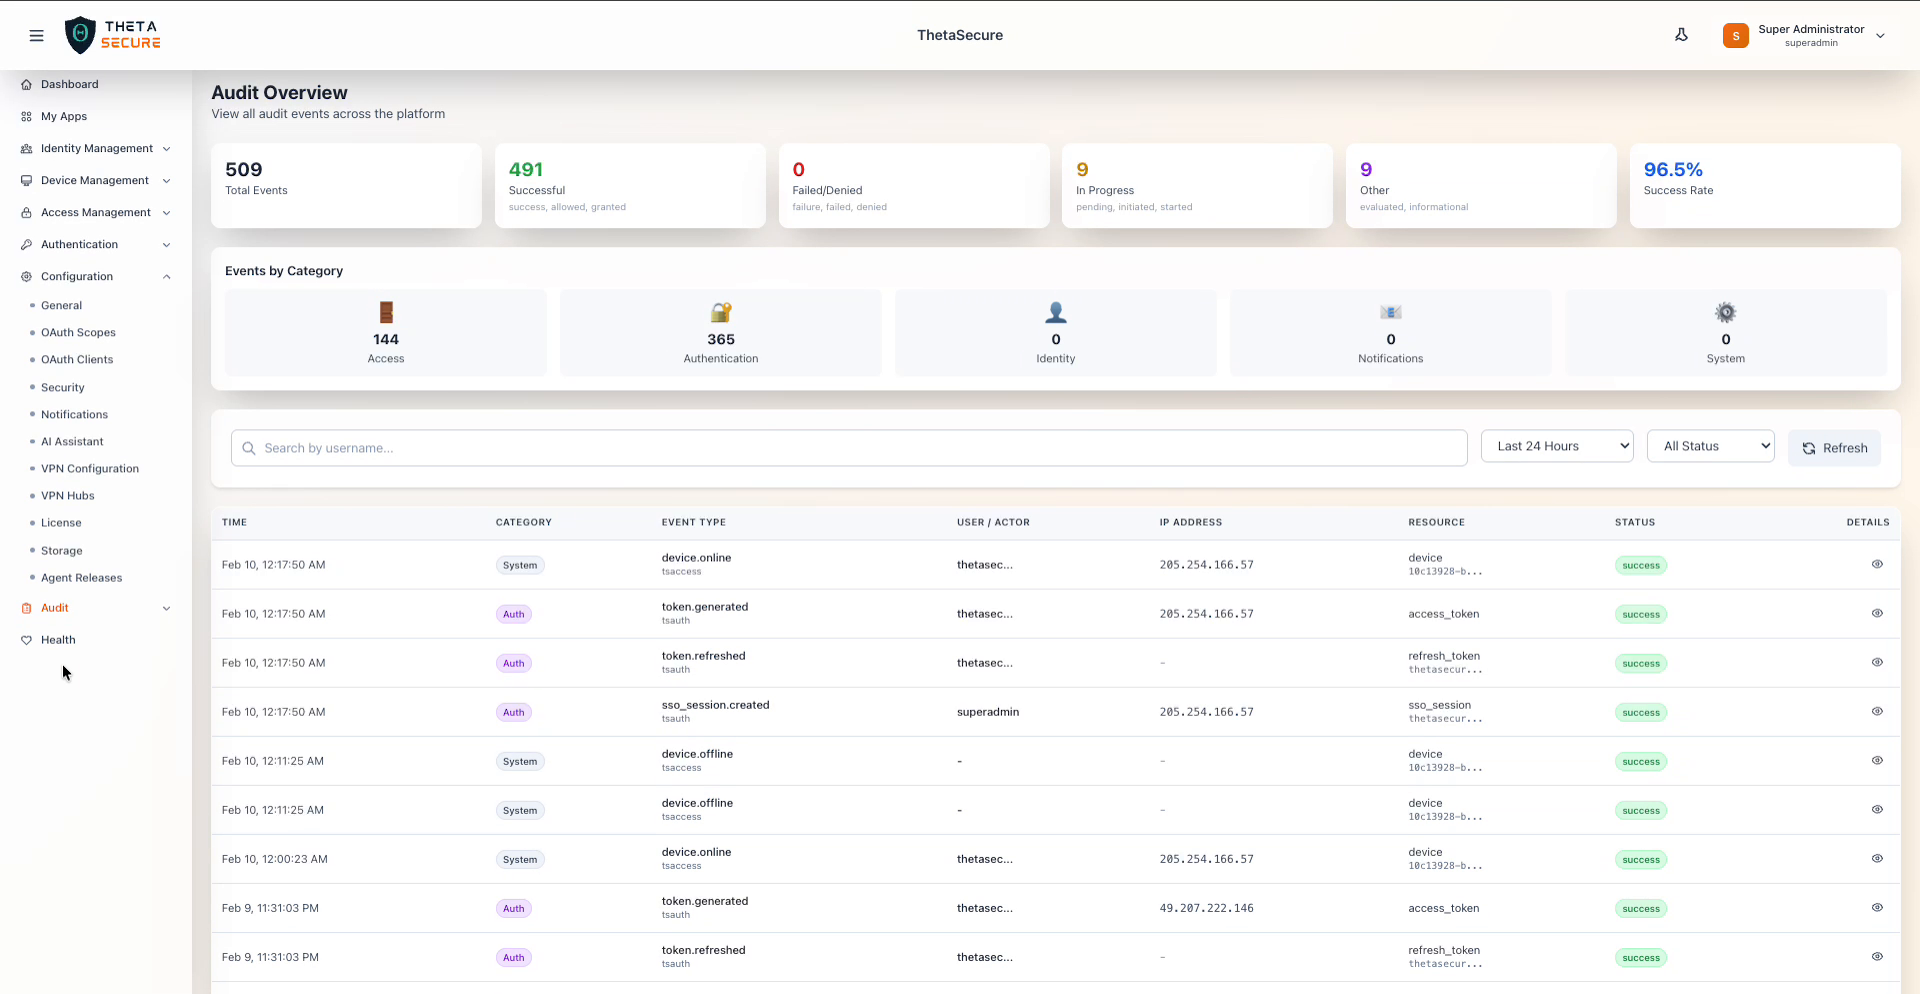
Summary Cards
The top of the page displays six summary cards that provide an at-a-glance view of audit activity for the selected time range.
| Card | Description |
|---|---|
| Total Events | The total number of audit events recorded. |
| Successful | Count of events with a positive outcome (success, allowed, granted). |
| Failed/Denied | Count of events with a negative outcome (failure, failed, denied). |
| In Progress | Count of events that are still ongoing (pending, initiated, started). |
| Other | Count of events with informational or evaluation statuses (evaluated, informational). |
| Success Rate | The percentage of successful events out of total events. |
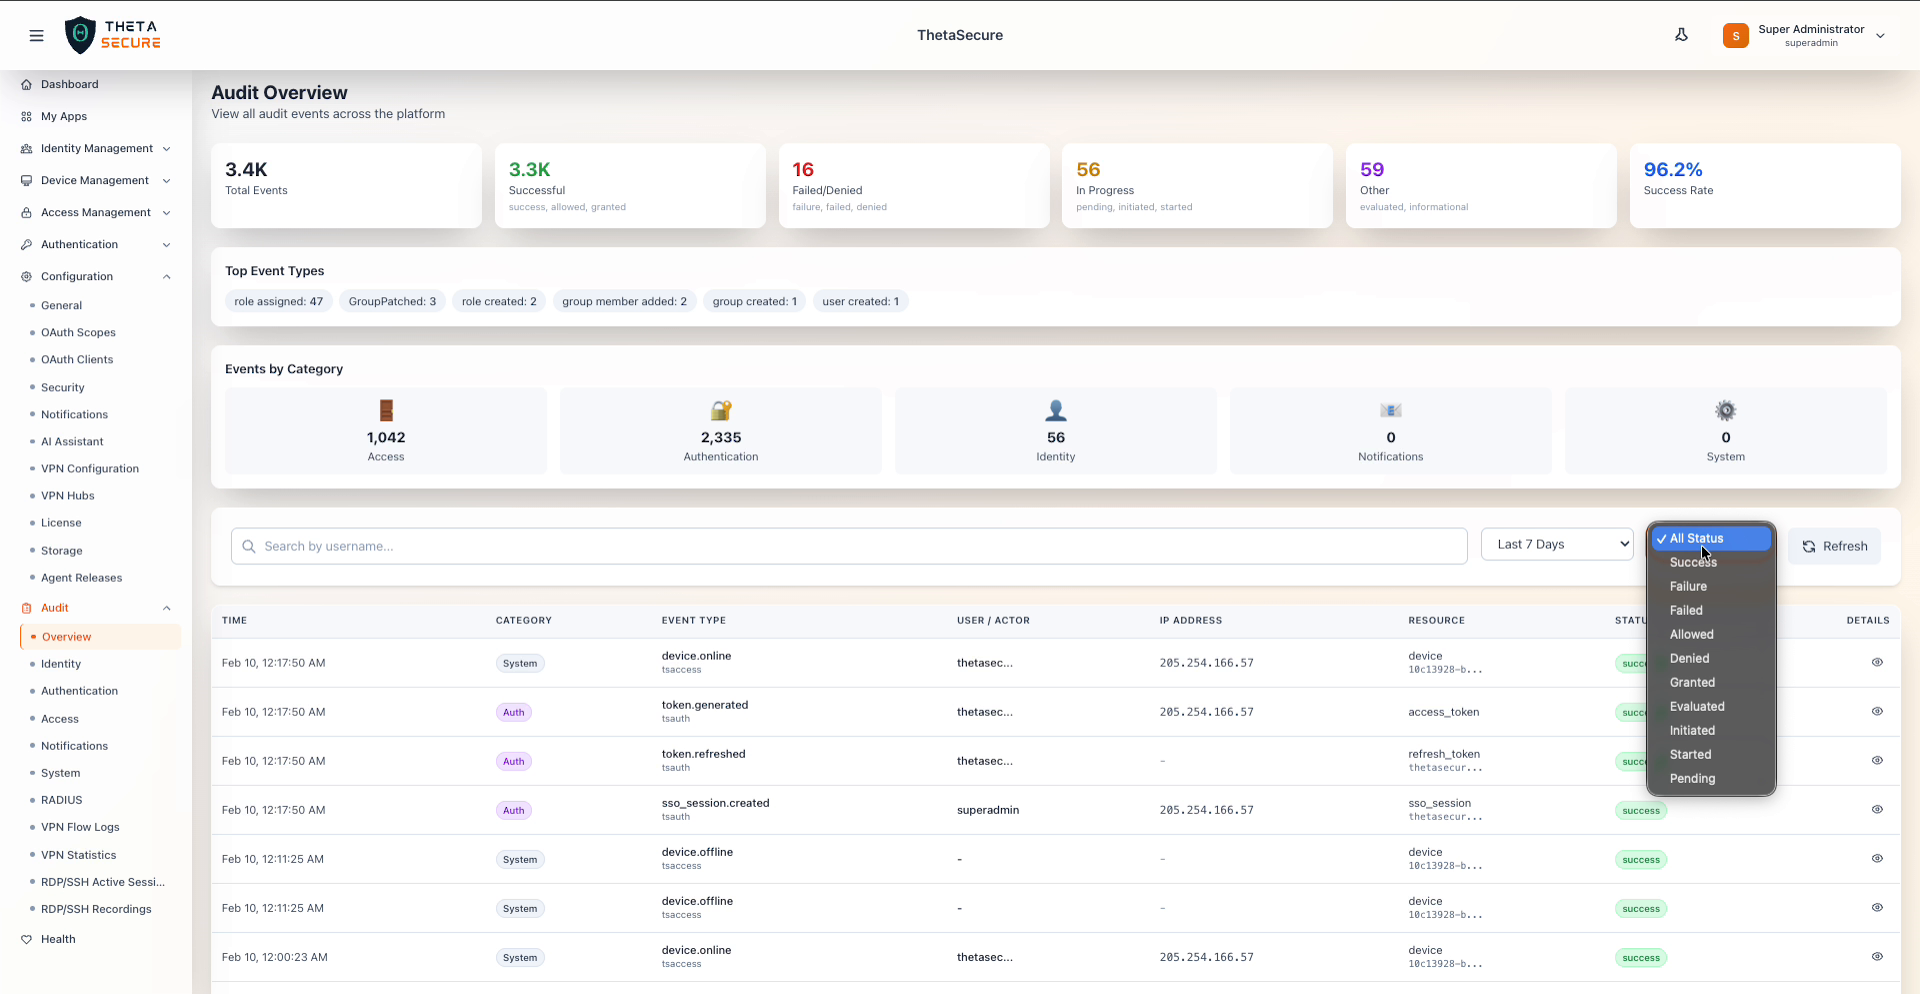
Top Event Types
When a longer time range is selected (e.g., Last 7 Days or more), a Top Event Types section appears below the summary cards. This displays the most frequently occurring event types as tag-style badges with their counts, for example: role assigned: 47, GroupPatched: 3, user created: 13.
Events by Category
This section breaks down the total event count into five category cards, each with an icon and count:
| Category | Description |
|---|---|
| Access | Events related to web apps, network apps, VPN, and device connectivity. |
| Authentication | Events related to logins, tokens, SSO sessions, MFA, and policies. |
| Identity | Events related to users, groups, roles, and permissions. |
| Notifications | Events related to email and SMS notifications. |
| System | Events related to scheduled jobs and cleanup tasks. |
Filters and Search
Below the category cards, a toolbar provides the following controls:
| Control | Description |
|---|---|
| Search by username | Free-text search to filter events by a specific username or actor. |
| Time Range | Dropdown to select the time window. Options: Last Hour, Last 24 Hours, Last 7 Days, Last 30 Days, Last 90 Days. |
| Status Filter | Dropdown to filter by event status. Options: All Status, Success, Failure, Failed, Allowed, Denied, Granted, Evaluated, Initiated, Started, Pending. |
| Refresh | Button to reload the event data with the current filters applied. |
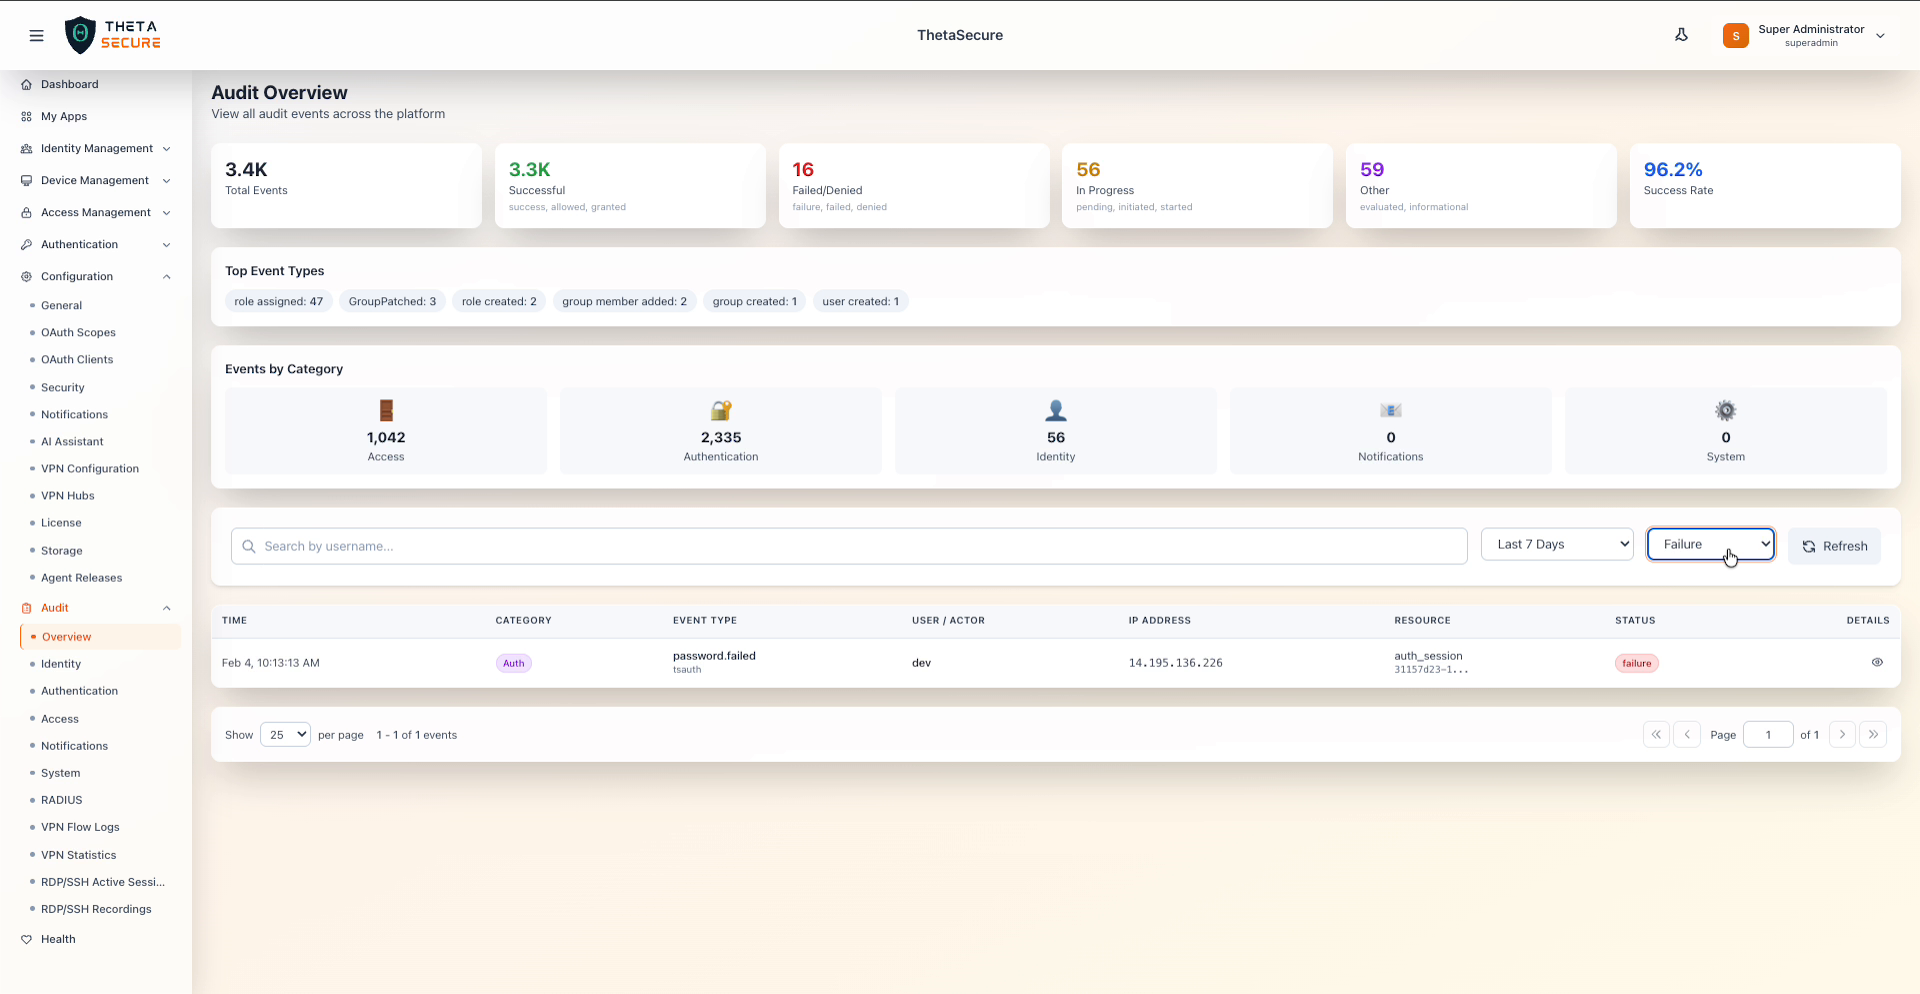
Filtering by Status
You can use the status filter to narrow down events. For example, selecting Failure will show only failed events such as password.failed:
Selecting Denied will show access-denied events such as access.denied:
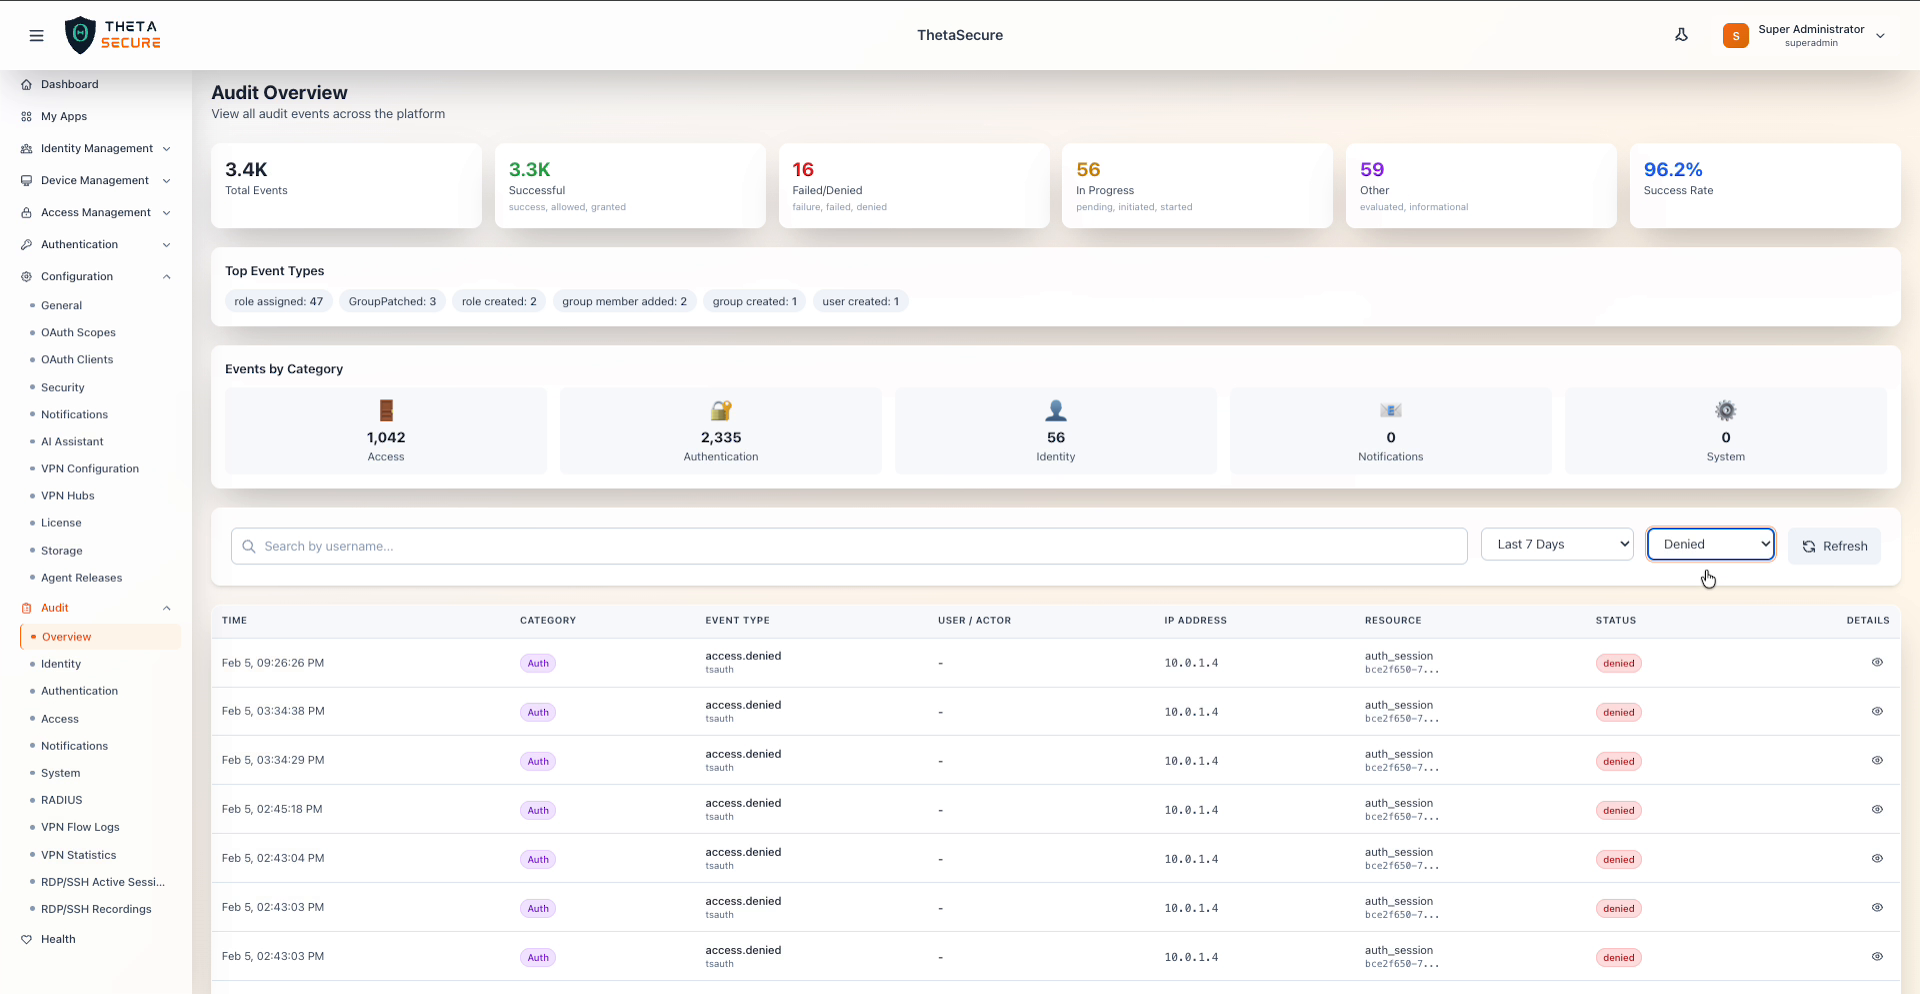
Event Log Table
The main event log table displays all audit events matching the current filters. Each row contains the following columns:
| Column | Description |
|---|---|
| Time | The date and time when the event occurred. |
| Category | A color-coded badge indicating the event category (e.g., System, Auth, Identity). |
| Event Type | The specific type of event (e.g., device.online, token.generated, sso_session.created). |
| User / Actor | The user or system actor that triggered the event. |
| IP Address | The IP address from which the event originated. |
| Resource | The resource affected by the event (e.g., device, access_token, refresh_token). |
| Status | A color-coded badge showing the event outcome (success, failure, denied). |
| Details | An eye icon button to open the Event Details panel. |
Event Details Panel
Clicking the eye icon on any event row opens a side panel with full event information:
- Tags — Category, event name, status, and service tags displayed as badges.
- Basic Information — Event ID, Event Type, and Action (e.g., Create, Update, Delete).
- Resource Information — Aggregate Type, Aggregate ID, Resource Type, and Resource ID.
- Actor Information — The Client ID or user that performed the action.
- Event Details — A JSON block with event-specific data fields.
- Metadata — Expandable section with additional metadata.
- Raw Event Data — Expandable section showing the complete raw event payload.
Click Close to dismiss the panel.
Pagination
The event log supports pagination at the bottom of the table:
- Show per page — Select how many events to display per page (default: 25).
- Page navigation — Navigate between pages using first, previous, next, and last page controls.
- Event count — Displays the current range and total number of events (e.g.,
1 - 25 of 509 events).