Access & Permissions Dashboard
The Access & Permissions Dashboard provides a comprehensive, consolidated view of your identity infrastructure, security posture, directory synchronization, and SSO integrations — all in a single pane.
Navigation: Dashboard → Access & Permissions tab
Dashboard Overview
This dashboard is organized into four primary widget areas, each providing a different lens into your IAM environment. A time filter in the top-right corner (defaulting to Last 7 Days) controls the reporting window, and a Refresh button pulls the latest data on demand.
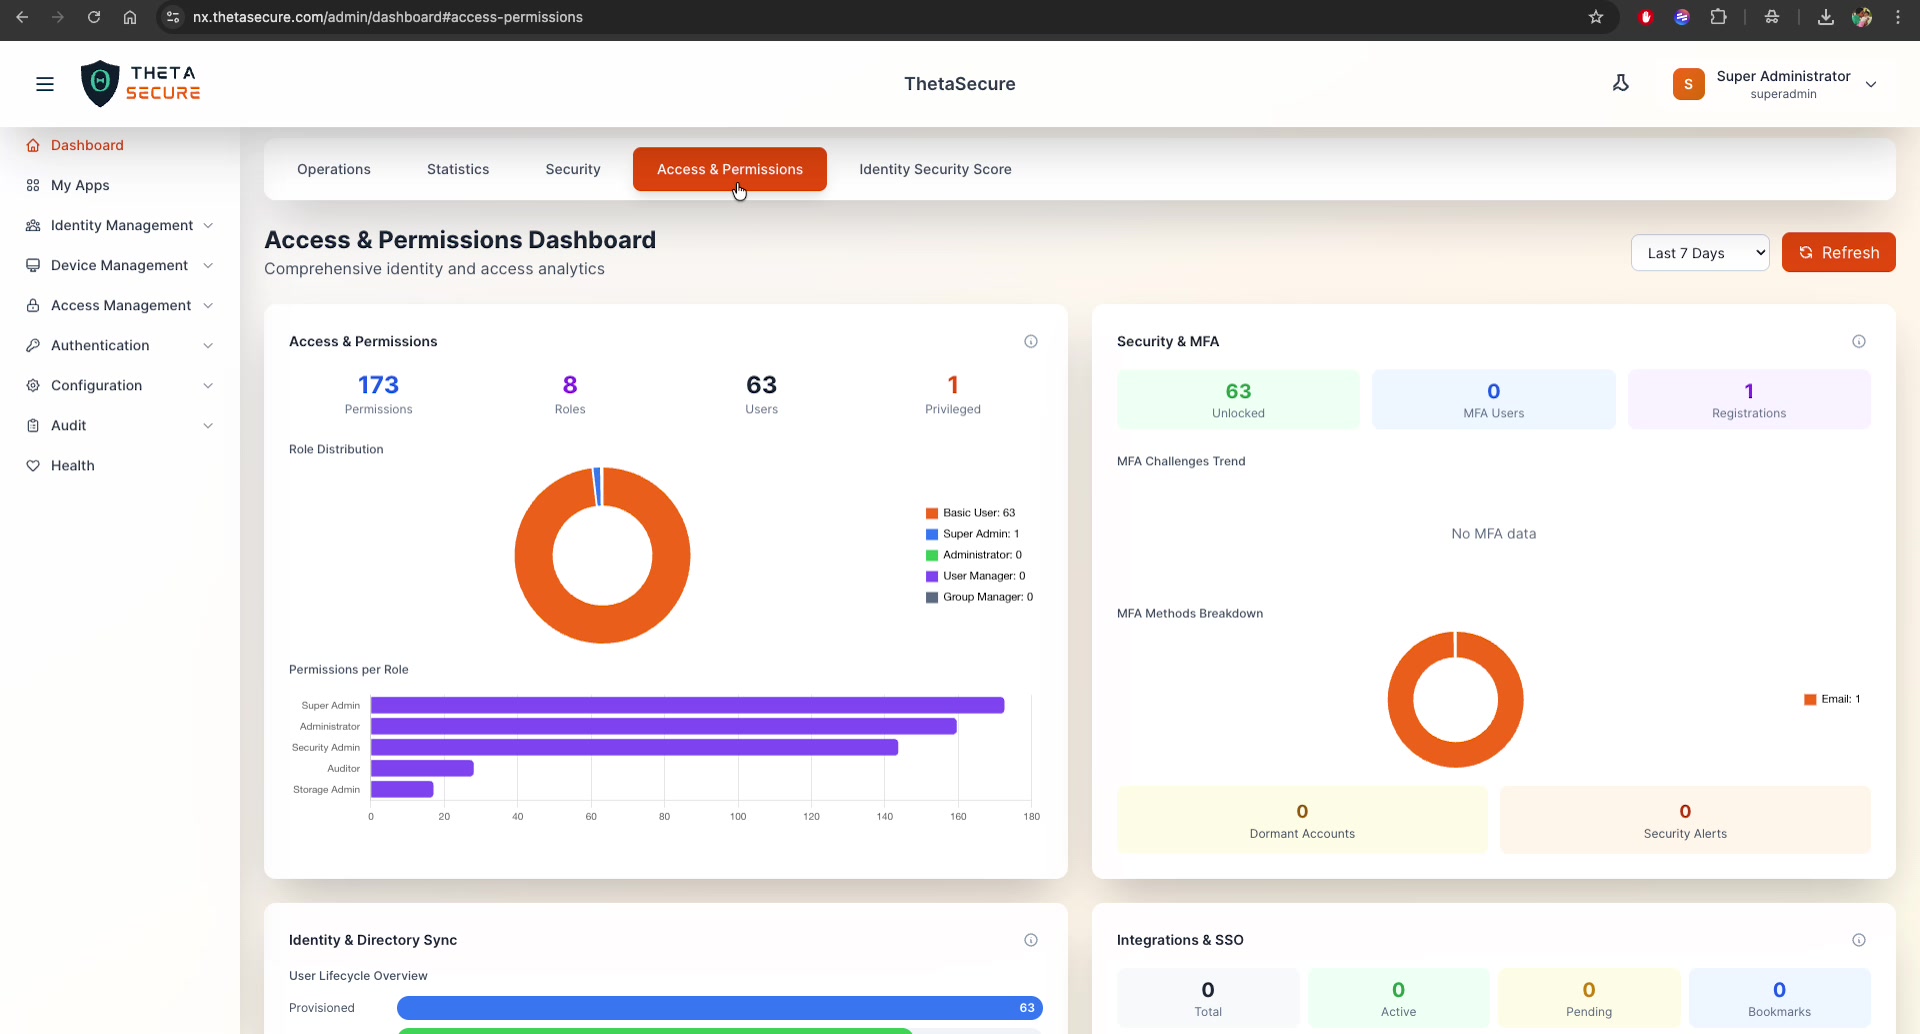
Access & Permissions Widget
The top-left widget provides a high-level inventory of your access control configuration:
| Metric | Description | Example |
|---|---|---|
| Permissions | Total number of permission rules defined | 173 |
| Roles | Number of roles configured | 8 |
| Users | Total user accounts in the system | 63 |
| Privileged | Number of users with privileged (admin-level) access | 1 |
Role Distribution
A donut chart visualizes the distribution of users across roles:
- Basic User — Standard users with limited permissions (e.g., 63)
- Super Admin — Full system access (e.g., 1)
- Administrator — Administrative access (e.g., 0)
- User Manager — User lifecycle management (e.g., 0)
- Group Manager — Group administration (e.g., 0)
Permissions per Role
A horizontal bar chart ranks each role by the number of assigned permissions, making it easy to identify over-permissioned roles at a glance:
- Super Admin — Highest permission count (~170+)
- Administrator — High permissions
- Security Admin — Moderate-high permissions
- Auditor — Limited, read-focused permissions
- Storage Admin — Minimal permissions
Roles with disproportionately high permission counts should be reviewed. Consider splitting broad roles into more granular ones following the principle of least privilege.
Security & MFA Widget
The top-right widget provides a snapshot of your authentication security posture:
| Metric | Description | Example |
|---|---|---|
| Unlocked | Users with active (non-locked) accounts | 63 |
| MFA Users | Users with MFA enabled | 0 |
| Registrations | Total MFA device registrations | 1 |
MFA Challenges Trend
A time-series chart showing MFA challenge activity over the selected period. When no MFA data is available, it displays "No MFA data."
MFA Methods Breakdown
A donut chart showing the distribution of registered MFA methods (e.g., Email, TOTP, Push, SMS). This helps you understand which MFA methods your users prefer.
Additional Metrics
| Metric | Description |
|---|---|
| Dormant Accounts | Accounts with no recent login activity — candidates for review or deprovisioning |
| Security Alerts | Active alerts related to access or authentication anomalies |
If MFA Users shows 0 while you have active users, MFA is not being enforced. Navigate to Authentication → MFA Policies to enable and enforce MFA for your organization.
Identity & Directory Sync Widget
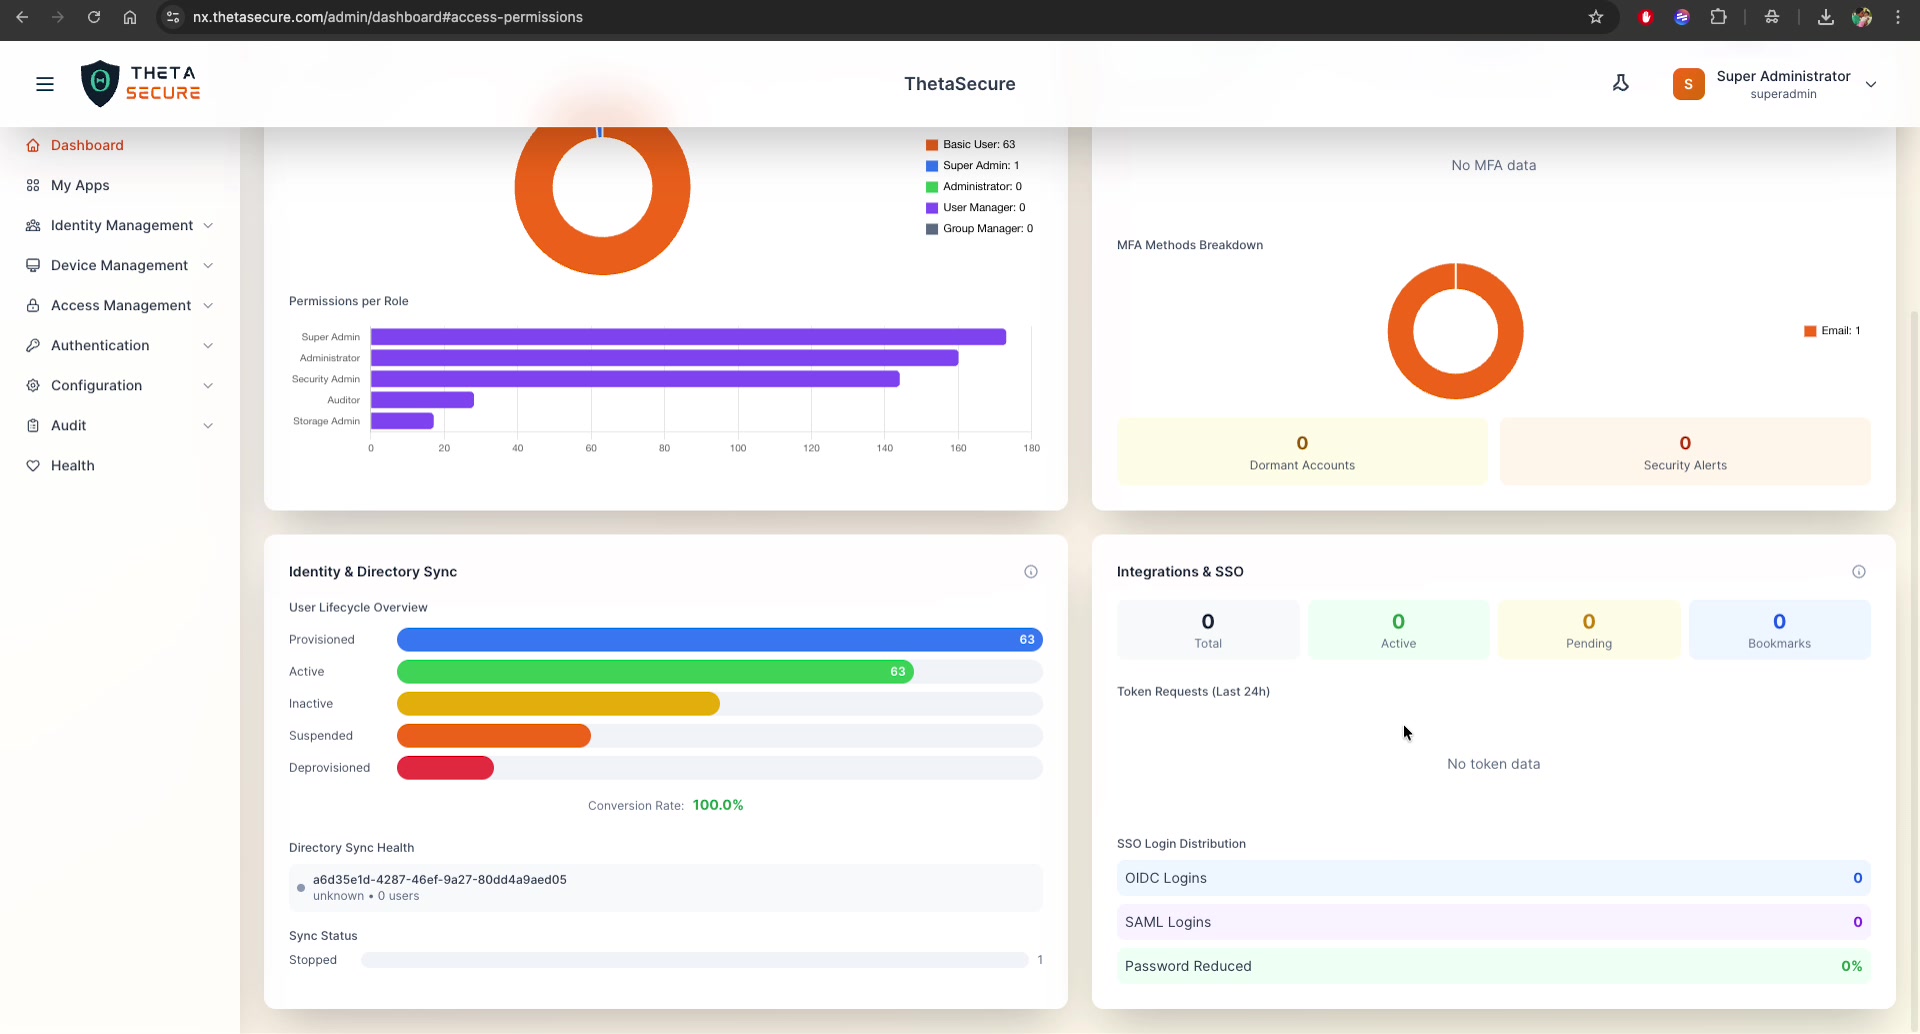
The bottom-left widget tracks user lifecycle and directory synchronization health:
User Lifecycle Overview
A horizontal bar chart showing user accounts across lifecycle stages:
| Stage | Description | Color |
|---|---|---|
| Provisioned | Users created/imported into ThetaSecure | Blue |
| Active | Users who have successfully logged in | Green |
| Inactive | Users with no recent activity | Yellow |
| Suspended | Temporarily disabled accounts | Orange |
| Deprovisioned | Removed or offboarded accounts | Red |
The Conversion Rate (e.g., 100.0%) shows the ratio of active users to provisioned users — a metric that indicates onboarding completion.
Directory Sync Health
Shows the status of each connected directory connector by ID, including the number of synced users and connection status.
Sync Status
Displays the current state of directory synchronization jobs (e.g., Stopped, Running, Failed) with a count of sync operations.
Integrations & SSO Widget
The bottom-right widget monitors your SSO and application integration status:
| Metric | Description |
|---|---|
| Total | Total number of integrated applications |
| Active | Currently active integrations |
| Pending | Integrations awaiting configuration or approval |
| Bookmarks | Bookmark-type applications (direct links without SSO) |
Token Requests (Last 24h)
Shows the volume of OAuth/OIDC token requests over the past 24 hours. "No token data" appears when no token activity has occurred.
SSO Login Distribution
Breaks down authentication by SSO protocol:
| Protocol | Description |
|---|---|
| OIDC Logins | OpenID Connect based authentications |
| SAML Logins | SAML 2.0 based authentications |
| Password Reduced | Percentage of logins using SSO instead of direct password entry |
A Password Reduced value of 0% indicates that SSO adoption is low. Integrating applications with OIDC or SAML significantly improves both security and user experience.
Common Use Cases
- Access reviews — Verify that the right users have the right roles and permissions
- MFA gap analysis — Identify users without MFA and plan enforcement rollout
- Onboarding health — Track provisioning-to-active conversion rates
- SSO adoption tracking — Monitor OIDC/SAML usage vs. password-based logins
- Dormant account cleanup — Identify and deprovision stale accounts