Identity Security Score
The Identity Security Score dashboard provides a comprehensive, real-time assessment of your organization's identity security posture. It combines threat intelligence, authentication analytics, access analysis, and account health into a single actionable view.
Navigation: Dashboard → Identity Security Score tab
Identity Security Score
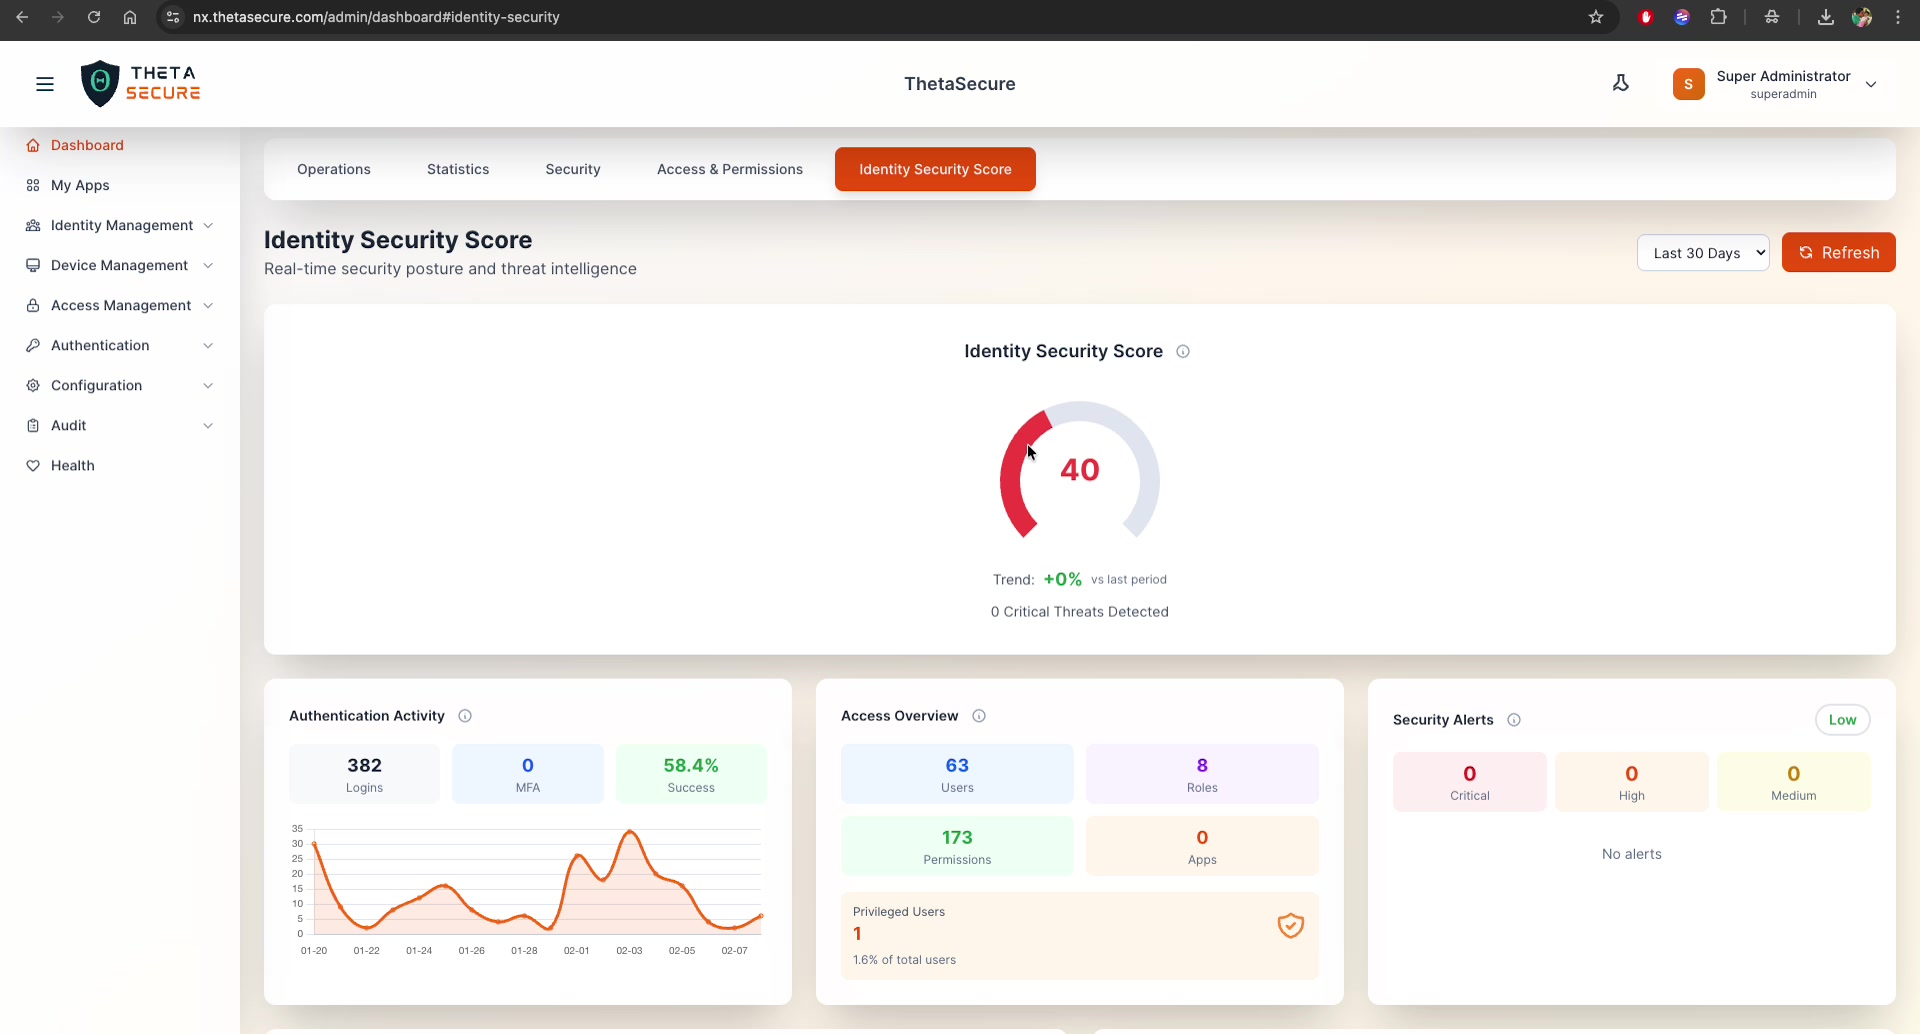
The headline metric is a composite security score ranging from 0 to 100, displayed as a prominent gauge at the top of the page.
Score Interpretation
| Score Range | Color | Status | Action |
|---|---|---|---|
| 80–100 | Green | Excellent | Maintain current posture |
| 60–79 | Yellow | Fair | Address flagged areas |
| 40–59 | Orange | Poor | Prioritize improvements |
| 0–39 | Red | Critical | Immediate action required |
How It's Calculated
The score is a weighted composite based on four key dimensions:
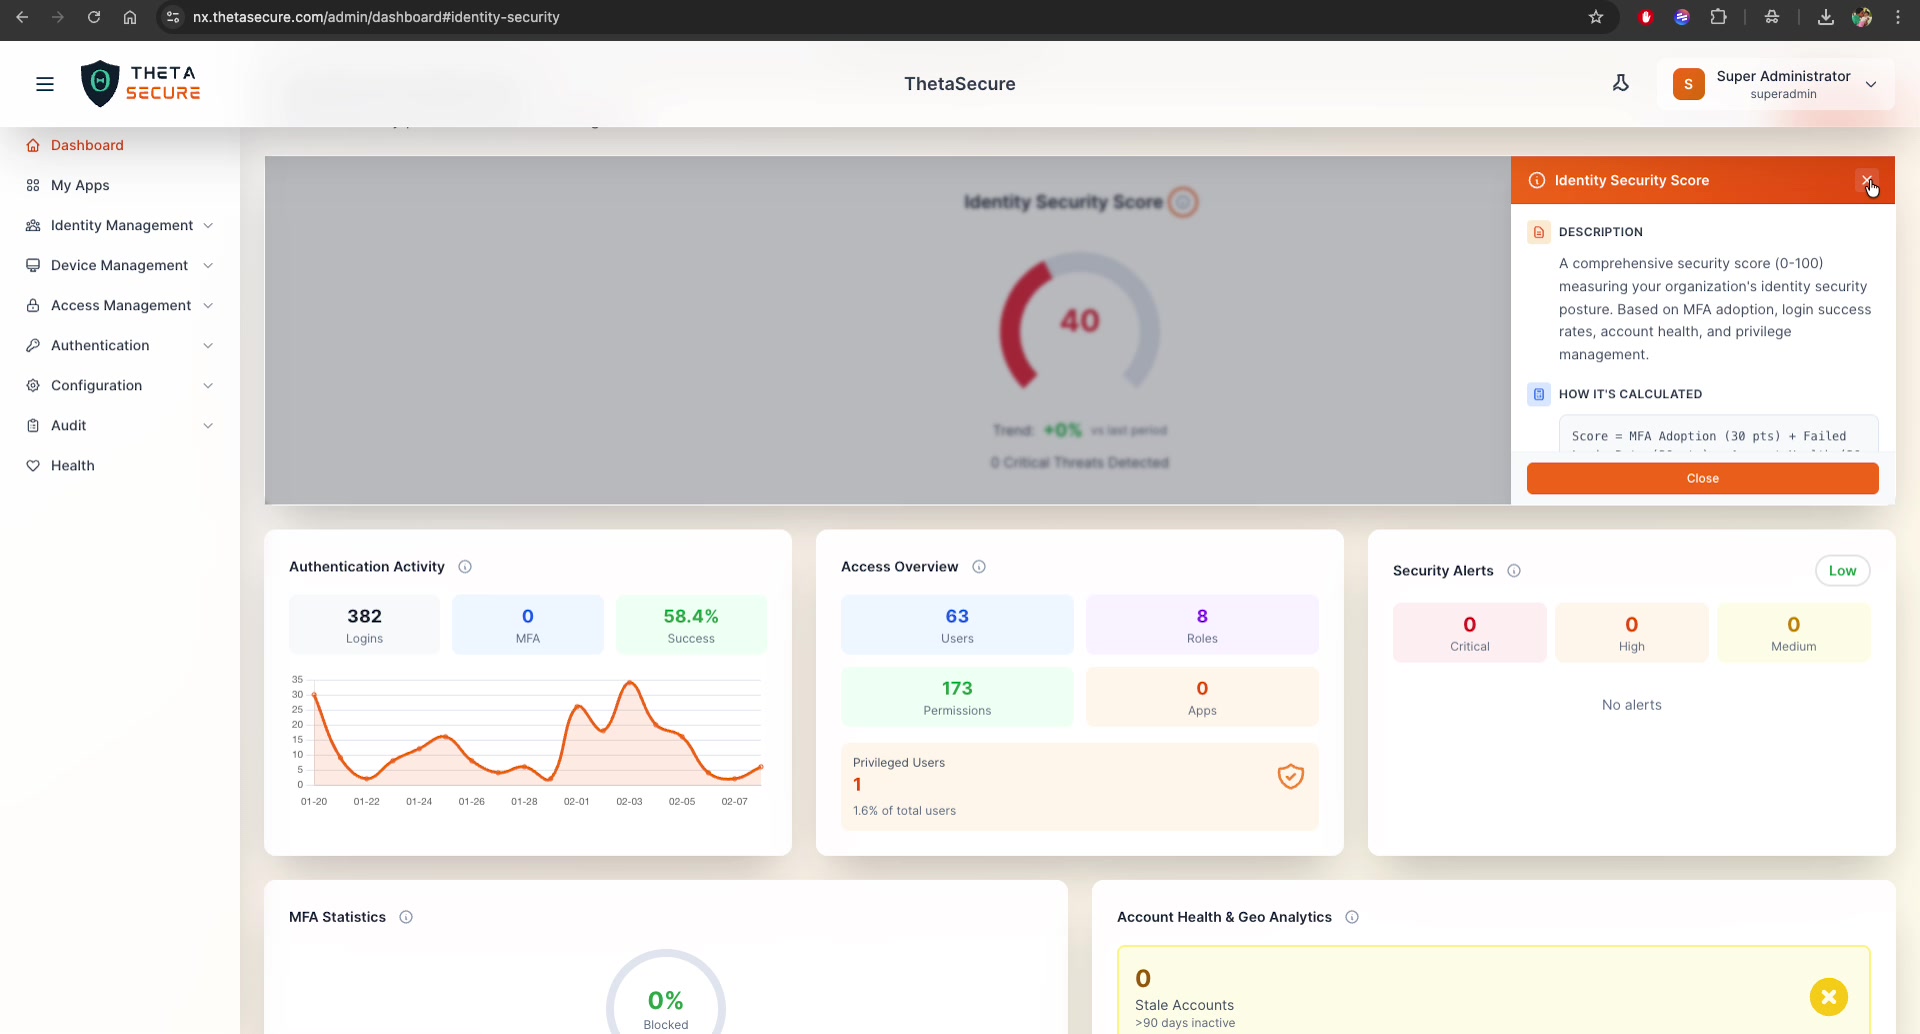
Score = MFA Adoption (30 pts) + Failed Login Rate (30 pts)
      + Account Health (20 pts) + Privileged Access (20 pts)
| Component | Max Points | What Improves It |
|---|---|---|
| MFA Adoption | 30 | Enable MFA for all users |
| Failed Login Rate | 30 | Lower failure rates (investigate brute-force, fix misconfigured accounts) |
| Account Health | 20 | Remove stale/orphaned accounts, maintain active accounts |
| Privileged Access | 20 | Minimize privileged users, follow least-privilege principle |
Trend & Threats
Below the score gauge, two indicators provide context:
- Trend — Percentage change compared to the last reporting period (e.g.,
+0% vs last period) - Critical Threats Detected — Count of active critical-severity threats (e.g.,
0 Critical Threats Detected)
Authentication Activity
Tracks authentication patterns over the selected time period:
| Metric | Description | Example |
|---|---|---|
| Logins | Total authentication attempts | 382 |
| MFA | Logins that included an MFA challenge | 0 |
| Success | Percentage of successful authentications | 58.4% |
A time-series chart plots login volume over the date range (e.g., 01-20 through 02-07), helping you identify patterns such as peak login periods, unusual spikes, or drops in activity.
A success rate below 60% indicates significant authentication issues. Investigate whether this is caused by misconfigured accounts, brute-force attacks, or user credential problems.
Access Overview
A summary of your identity infrastructure at a glance:
| Metric | Description | Example |
|---|---|---|
| Users | Total user accounts | 63 |
| Roles | Defined roles | 8 |
| Permissions | Total permission rules | 173 |
| Apps | Integrated applications | 0 |
Privileged Users
Displays the count and percentage of users with administrative or privileged roles:
- Count: Number of privileged users (e.g.,
1) - Percentage: Share of total users (e.g.,
1.6% of total users) - Status icon: Green checkmark (✅) when within acceptable limits
Industry guidelines recommend keeping privileged users below 5% of your total user base. ThetaSecure flags this metric with a warning if the ratio exceeds recommended thresholds.
Security Alerts
Real-time security alert monitoring with severity classification:
| Severity | Count | Color |
|---|---|---|
| Critical | Immediate threats requiring urgent action | Red |
| High | Significant risks requiring prompt attention | Orange |
| Medium | Moderate risks for scheduled review | Yellow |
An overall risk badge (e.g., Low, Medium, High, Critical) is displayed in the top-right corner of the widget. When no alerts are active, it shows "No alerts."
MFA Statistics
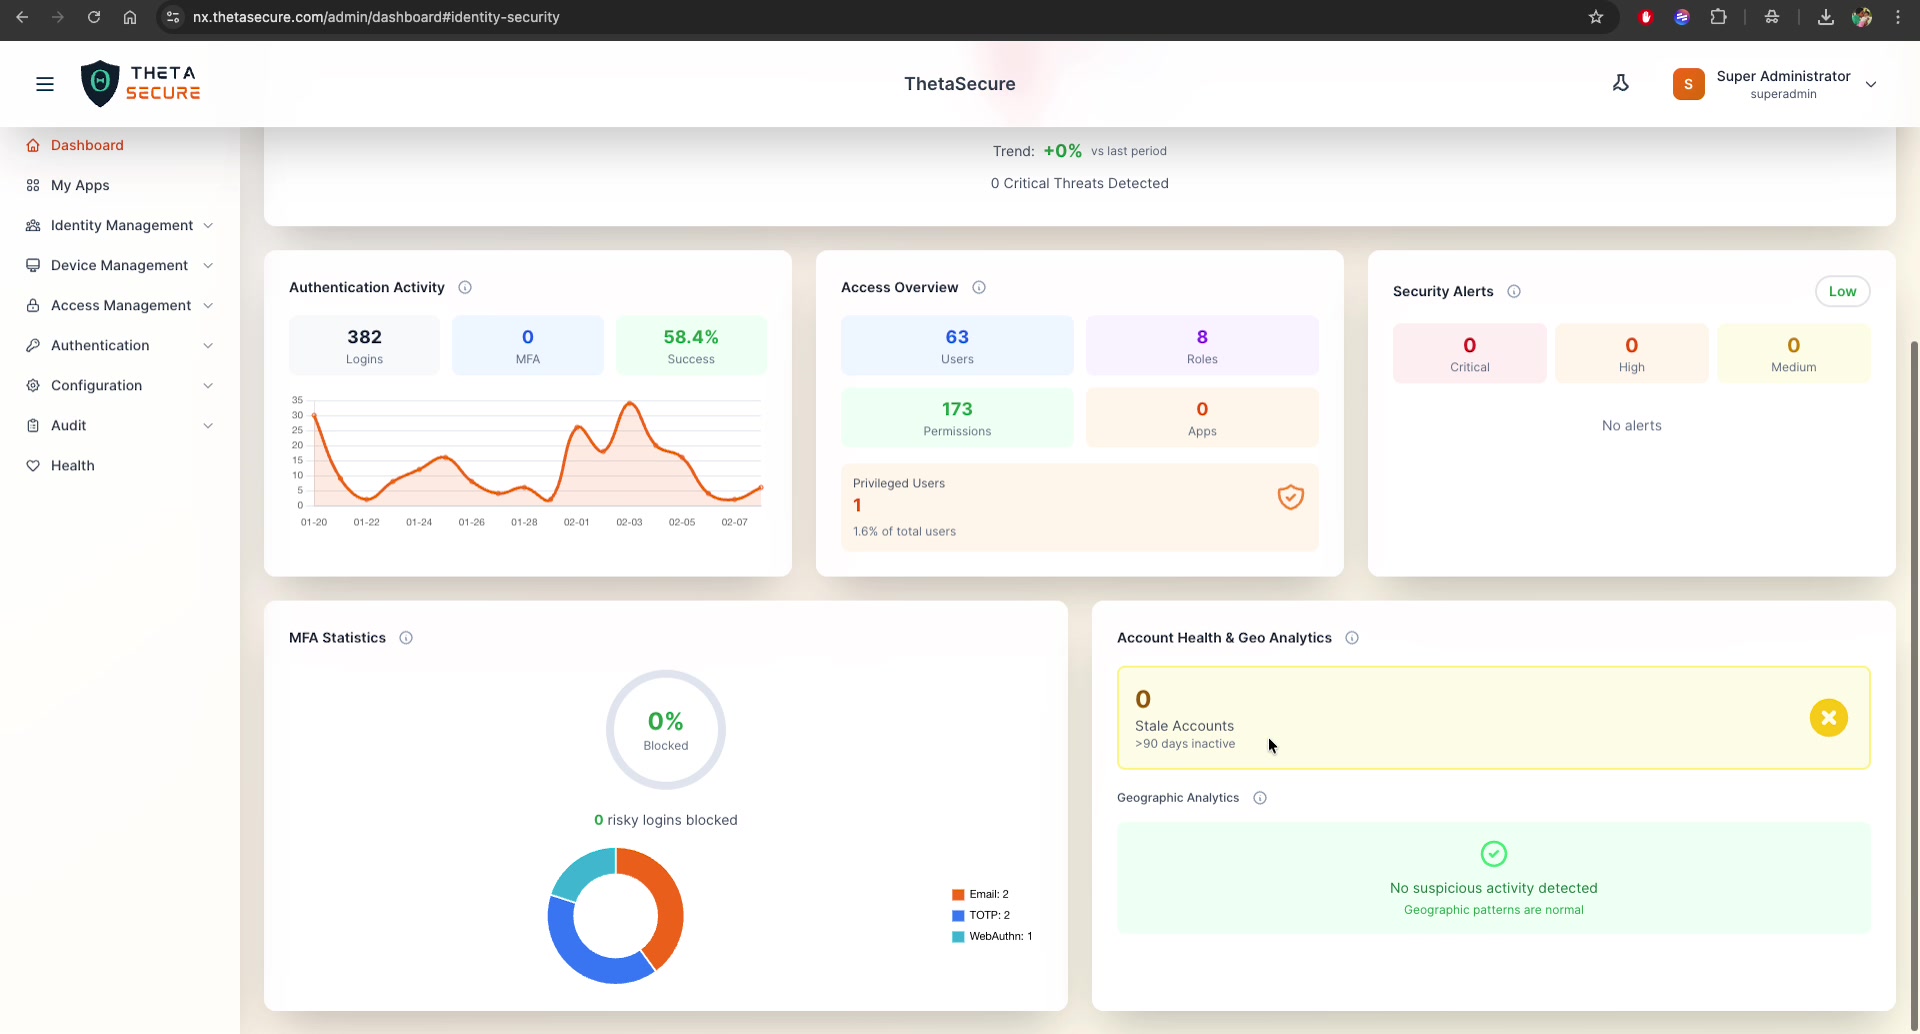
Provides a detailed view of your MFA deployment:
Risky Login Blocking
- Blocked percentage — Gauge showing the rate of risky logins blocked by MFA (e.g.,
0% Blocked) - Count — Total number of risky logins blocked (e.g.,
0 risky logins blocked)
MFA Methods Distribution
A donut chart breaking down registered MFA methods:
| Method | Description |
|---|---|
| Email-based one-time codes | |
| TOTP | Time-based one-time passwords (Authenticator apps) |
| WebAuthn | Hardware security keys or biometric authentication |
| SMS | Text message based codes |
| Push | Push notification to mobile app |
This distribution helps you understand which methods are adopted and plan migration strategies (e.g., moving from SMS to TOTP/WebAuthn for stronger security).
Account Health & Geo Analytics
Stale Accounts
Identifies accounts that have been inactive for more than 90 days:
- Count: Number of stale accounts (e.g.,
0) - Threshold: >90 days inactive
- Status icon: Red ✕ when stale accounts exist, green ✓ when clean
Stale accounts are security risks — they can be targets for account takeover. Review and deprovision them regularly.
Geographic Analytics
Monitors login activity for geographic anomalies:
- No suspicious activity detected — Geographic patterns are normal
- Suspicious activity detected — Logins from unexpected locations flagged for review
Geographic analytics helps detect impossible travel scenarios (e.g., a user logging in from two distant locations within a short time frame) and logins from high-risk regions.
Time Range Filter
The Identity Security Score dashboard supports configurable time ranges:
| Option | Description |
|---|---|
| Last 7 Days | Weekly view |
| Last 30 Days | Monthly trends (default) |
| Last 90 Days | Quarterly overview |
| Custom Range | Specify exact dates |
Click Refresh to pull the latest data.
Improving Your Score
Based on the scoring formula, here are the highest-impact actions ordered by potential point gain:
- Enable MFA for all users (+30 pts potential) — The single biggest improvement. Navigate to Authentication → MFA Policies
- Reduce failed login rate (+30 pts potential) — Investigate failure patterns in the Operations Dashboard, fix misconfigured accounts, enforce stronger passwords
- Clean up stale accounts (+20 pts potential) — Deprovision accounts inactive for 90+ days
- Review privileged access (+20 pts potential) — Audit admin accounts, remove unnecessary privileges, enforce just-in-time access
A score of 40 or below indicates critical security gaps. Address MFA adoption and authentication failure rates as immediate priorities.