Operations Dashboard
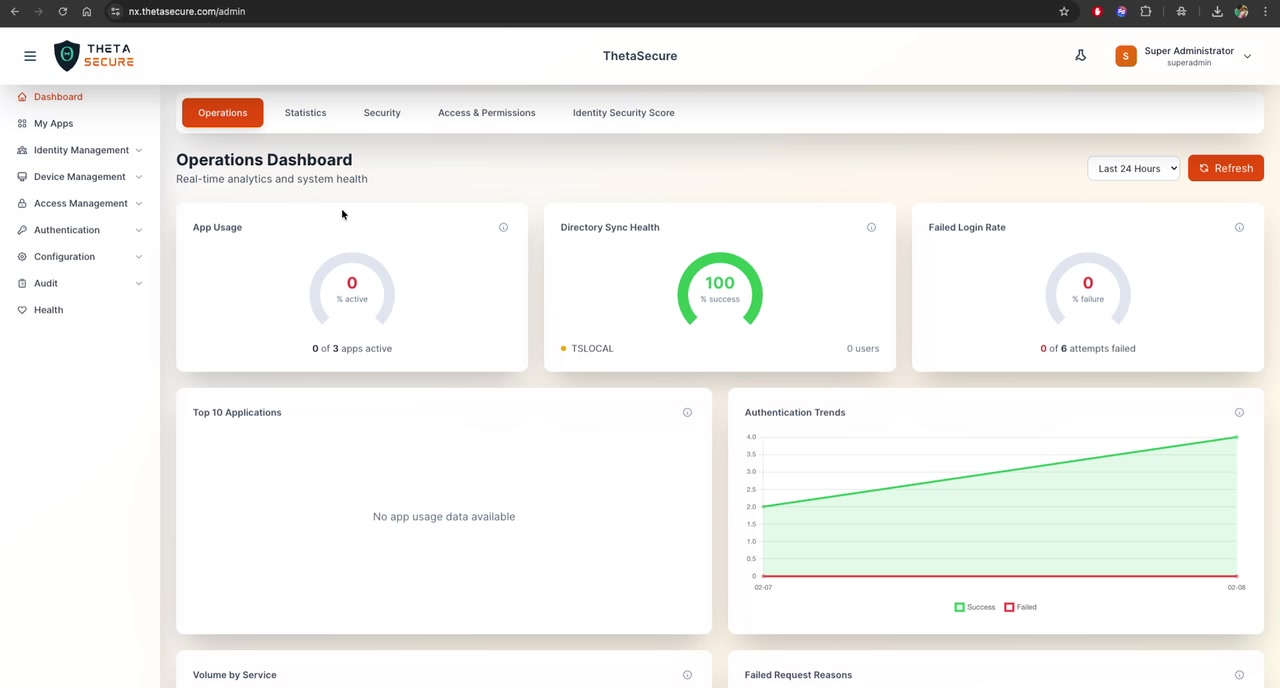
The Operations Dashboard is your primary monitoring view for real-time system health and authentication activity. It is the default view when you sign in to ThetaSecure.
Navigation: Dashboard \u2192 Operations tab
Dashboard Overview
The Operations Dashboard displays real-time analytics across six key areas. A time filter in the top-right corner (defaulting to Last 24 Hours) controls the date range for all widgets. Click Refresh to update data on demand.
Widgets
App Usage
Displays the number of currently active applications out of total registered apps.
- Metric: Percentage of active apps and count (e.g., \