RADIUS Audit
The RADIUS Audit page lets you monitor authentication and accounting events generated by your RADIUS server. This is essential for tracking network access control activity such as Wi-Fi authentication, VPN dial-in, and wired 802.1X sessions handled through RADIUS. Navigate to Audit → RADIUS from the sidebar.
Overview
The page opens with summary metric cards at the top and an event table below, organized into three tabs: All Events, Authentication, and Accounting. Each tab adjusts both the metric cards and the available filters to match the event category.
All Events Tab
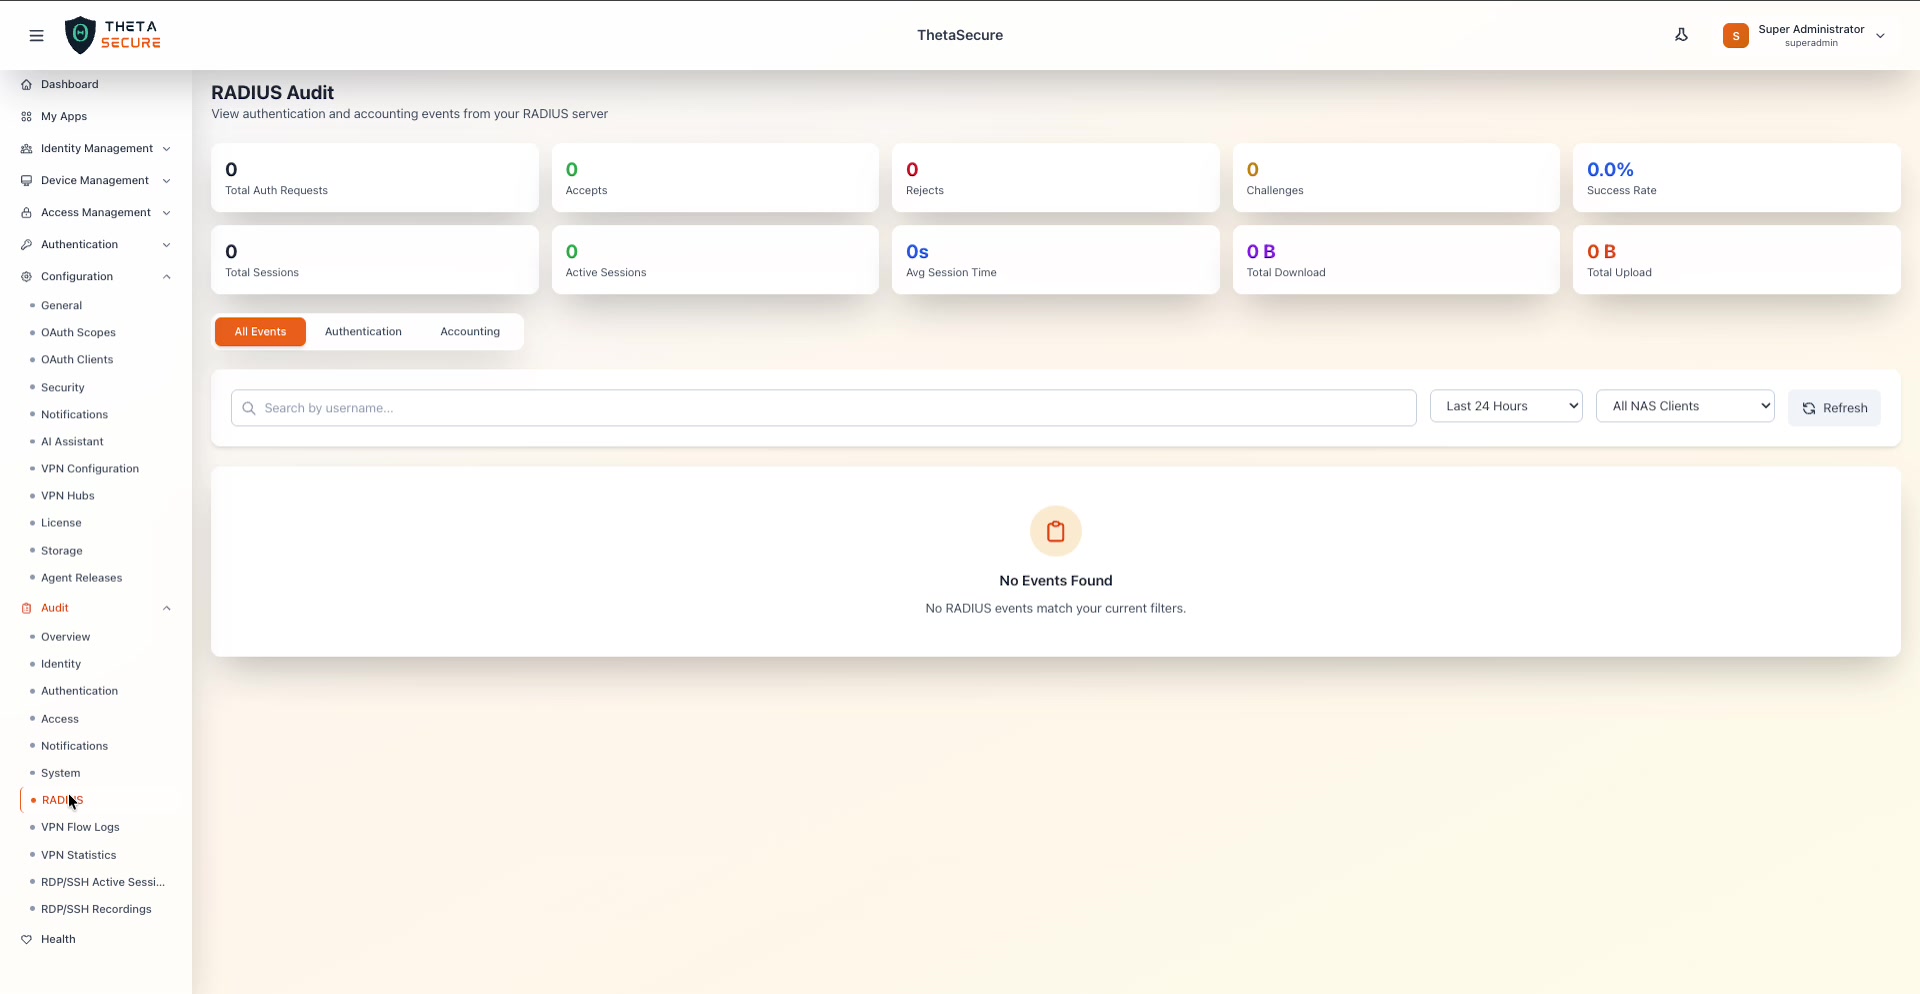 The All Events tab shows two rows of metric cards. The top row displays Total Auth Requests, Accepts, Rejects, Challenges, and Success Rate. The bottom row shows Total Sessions, Active Sessions, Avg Session Time, Total Download, and Total Upload. Below the cards, the event table provides a search bar, a time range dropdown, and an All NAS Clients filter.
The All Events tab combines both authentication and accounting events into a single view. The metric cards provide a comprehensive snapshot of RADIUS activity.
Authentication Metrics
| Card | Description |
|---|---|
| Total Auth Requests | The total number of RADIUS authentication requests received in the selected time range. |
| Accepts | The number of requests that resulted in an Access-Accept response (successful authentication). Shown in green. |
| Rejects | The number of requests that resulted in an Access-Reject response (failed authentication). |
| Challenges | The number of requests that resulted in an Access-Challenge response (additional credentials required, e.g., MFA). |
| Success Rate | The percentage of authentication requests that were accepted. |
Accounting Metrics
| Card | Description |
|---|---|
| Total Sessions | The total number of RADIUS accounting sessions recorded. |
| Active Sessions | The number of sessions currently in progress. Shown in green. |
| Avg Session Time | The average duration of completed sessions. |
| Total Download | The aggregate bytes downloaded across all sessions. |
| Total Upload | The aggregate bytes uploaded across all sessions. |
Authentication Tab
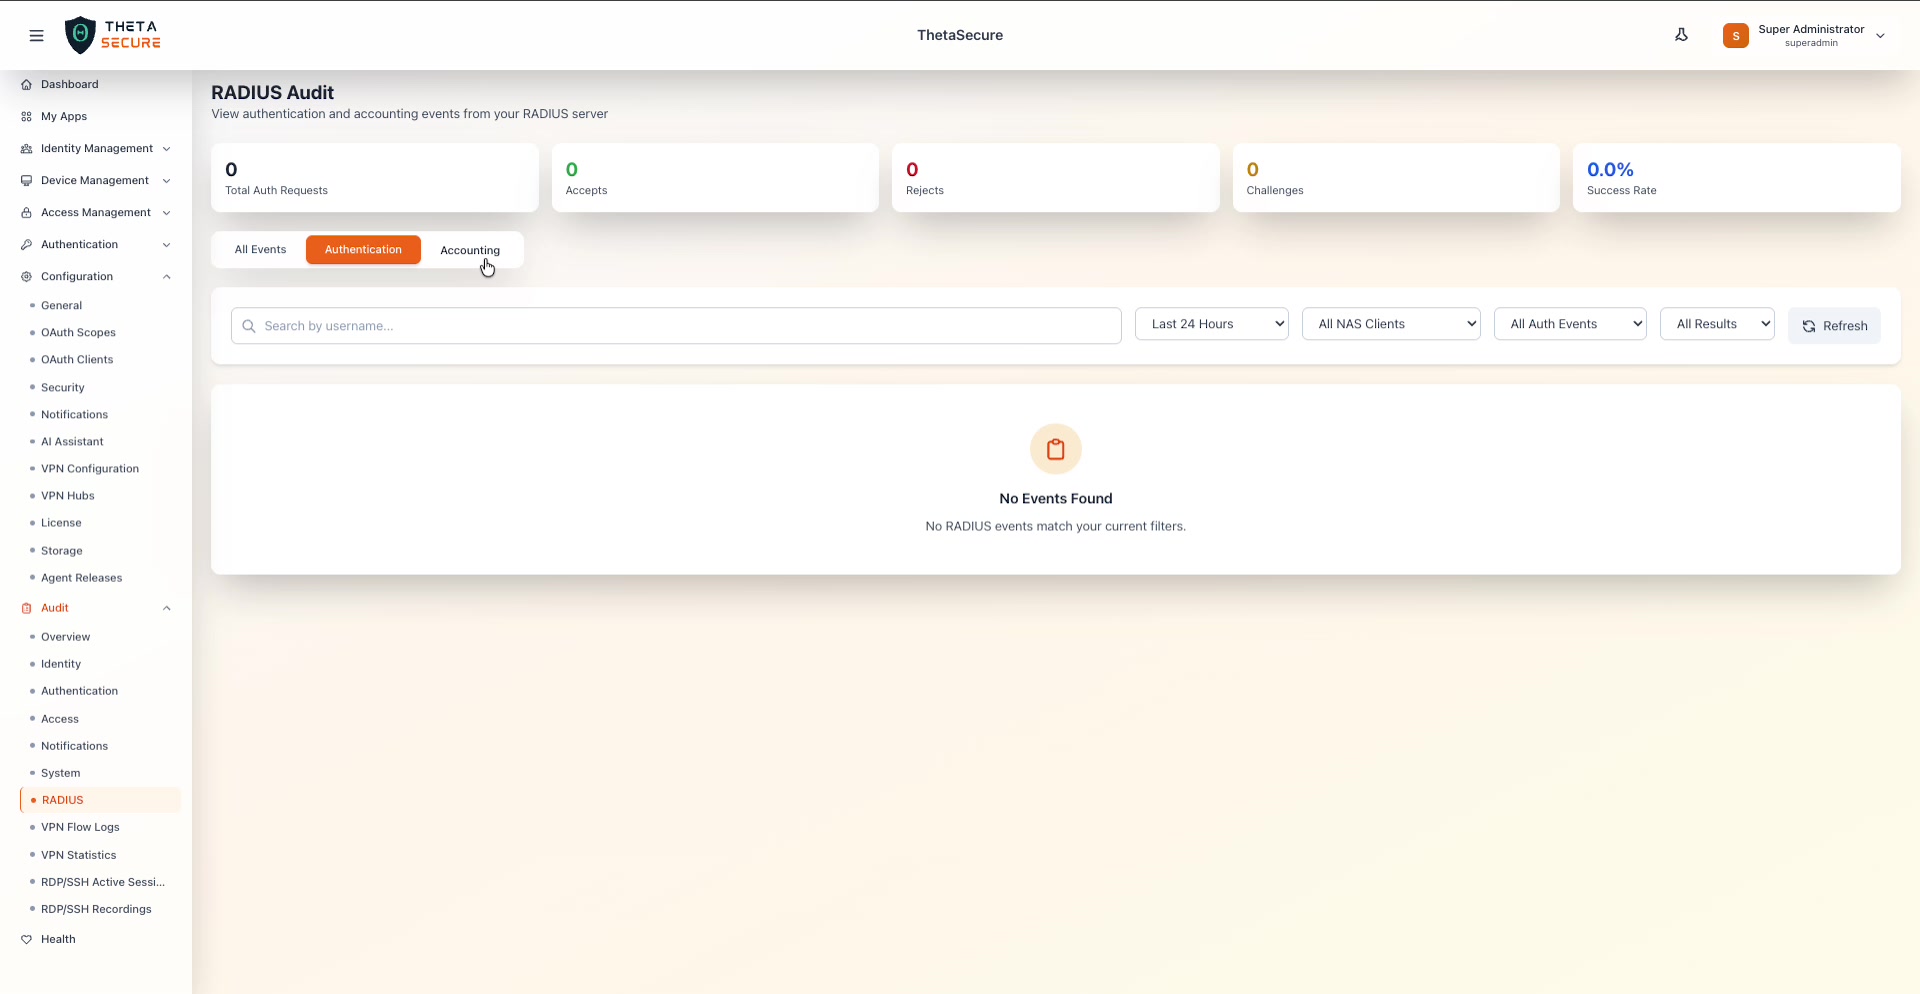 The Authentication tab focuses on access control events. The metric cards show only authentication metrics (Total Auth Requests, Accepts, Rejects, Challenges, Success Rate). The filter bar includes time range, NAS Clients, All Auth Events type filter, and an All Results outcome filter.
The Authentication tab provides additional filtering options specific to authentication events:
| Filter | Options | Description |
|---|---|---|
| Time Range | Last 24 Hours, Last 7 Days, Last 30 Days, Last 90 Days | The time window to query. |
| NAS Clients | All NAS Clients, or specific clients | Filter by the Network Access Server that originated the request. |
| Auth Events | All Auth Events, or specific event types | Filter by authentication event type. |
| Results | All Results, or specific outcomes | Filter by authentication outcome (Accept, Reject, Challenge). |
Accounting Tab
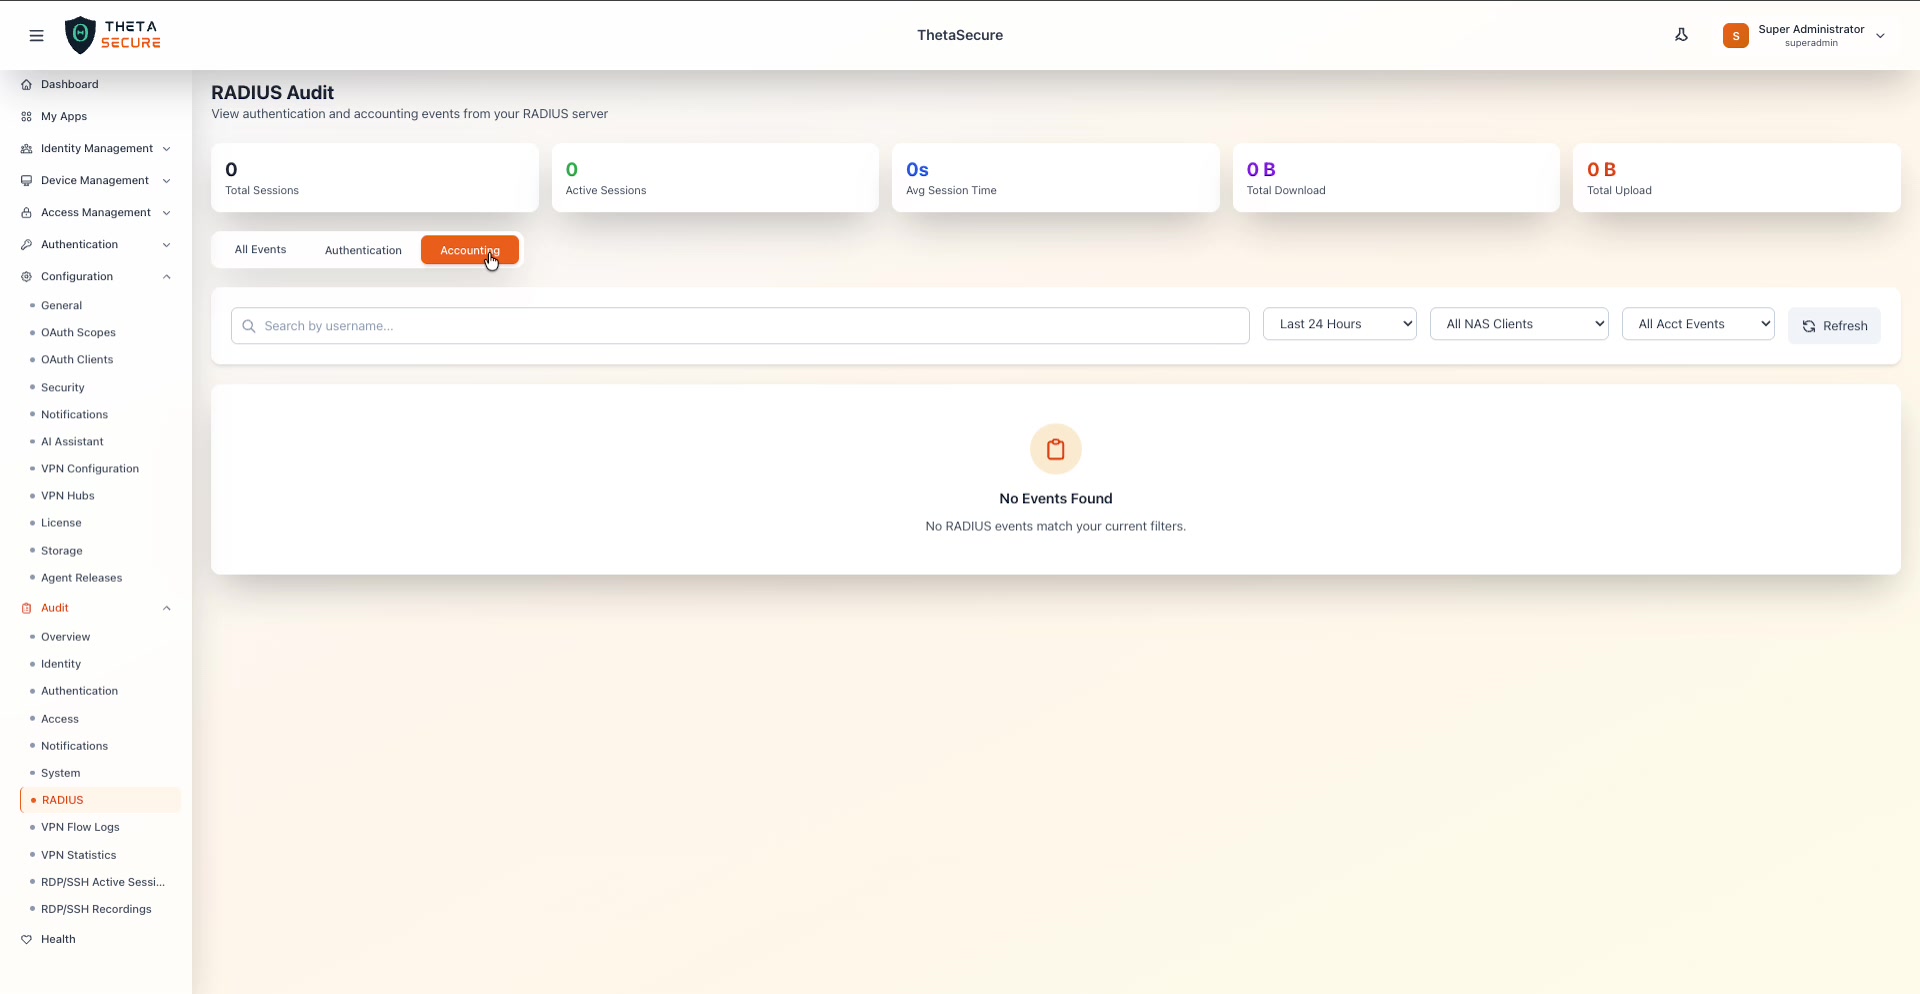 The Accounting tab shows session-related metrics (Total Sessions, Active Sessions, Avg Session Time, Total Download, Total Upload). The filter bar includes time range, NAS Clients, and an All Acct Events dropdown.
The Accounting tab tracks RADIUS accounting records that log session lifecycle events.
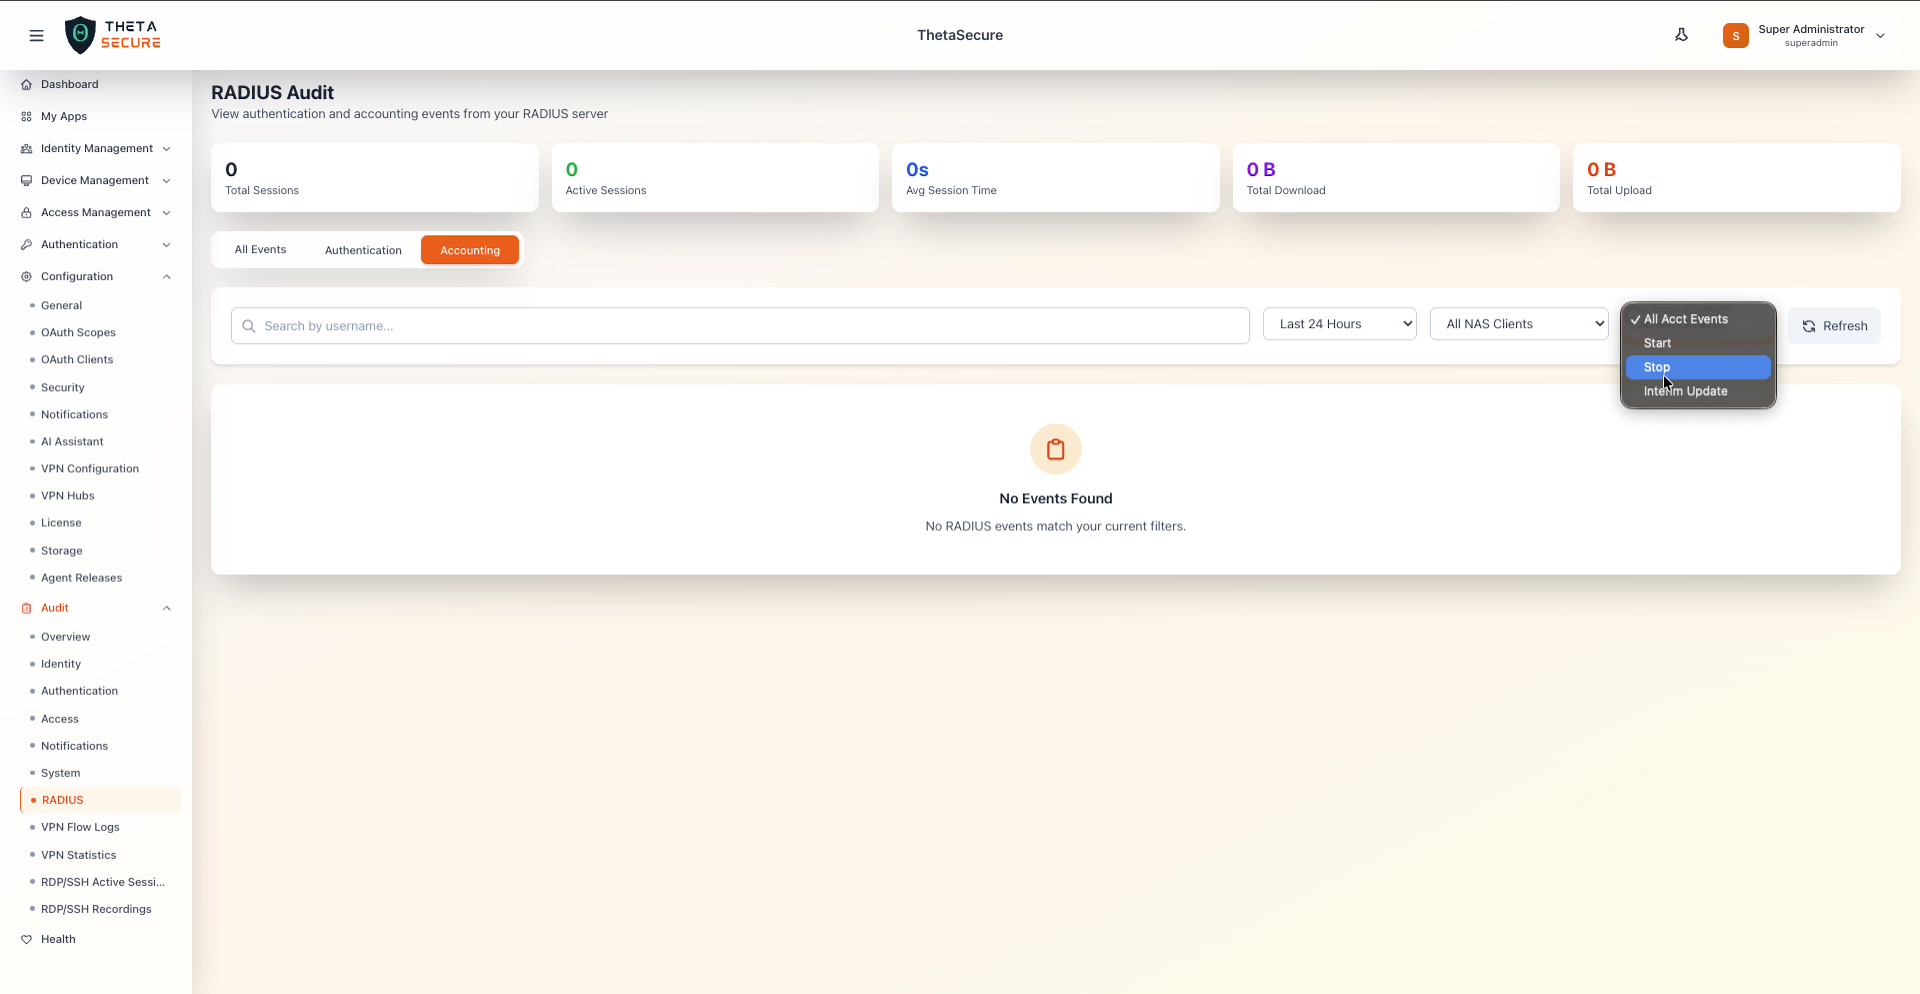 The All Acct Events dropdown offers four filter options: All Acct Events (default), Start (session initiation), Stop (session termination), and Interim Update (periodic session updates).
| Accounting Event | Description |
|---|---|
| Start | A session has been initiated. The NAS sends this when a user successfully authenticates and begins using the network. |
| Stop | A session has ended. Contains the final session duration, bytes transferred, and termination cause. |
| Interim Update | A periodic update sent during an active session. Contains running totals of session time and data usage. |
Common Filters
All three tabs share the following filter controls:
| Filter | Description |
|---|---|
| Search by username | Free-text search to find events for a specific user. |
| Time Range | Dropdown to select the lookback period (Last 24 Hours, Last 7 Days, etc.). |
| NAS Clients | Filter events by the specific Network Access Server that handled the request. |
| Refresh | Reload the event table with the current filter settings. |
Use the NAS Clients filter to isolate events from a specific access point or VPN concentrator when troubleshooting connectivity issues for a particular network segment.