VPN Statistics
The VPN Statistics page (labeled VPN Flow Statistics in the interface) provides a visual analytics dashboard for your VPN traffic. While the VPN Flow Logs page shows individual flow records, this page aggregates that data into charts and rankings that reveal traffic patterns, protocol distribution, top destinations, and per-server utilization. Navigate to Audit → VPN Statistics from the sidebar.
Summary Cards
The same five metric cards from VPN Flow Logs appear at the top, providing the aggregate numbers for the selected time range.
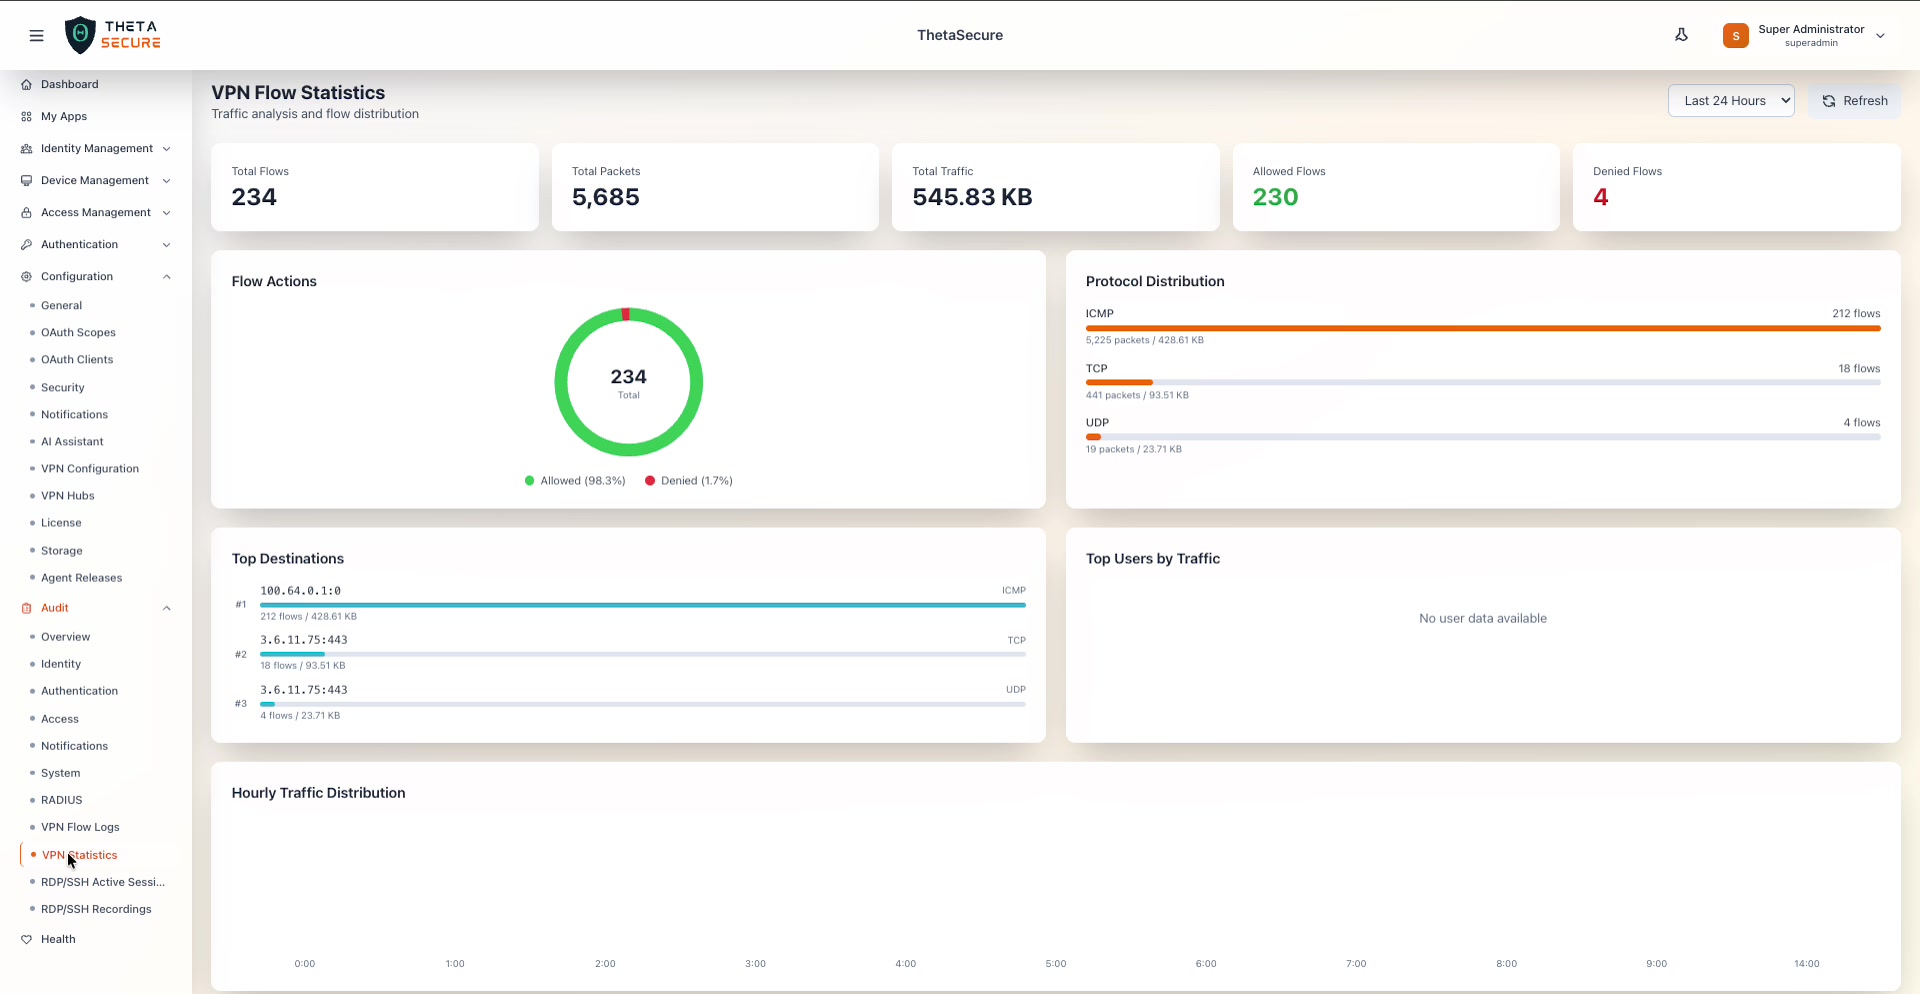 The VPN Flow Statistics dashboard showing Total Flows (234), Total Packets (5,685), Total Traffic (545.83 KB), Allowed Flows (230), and Denied Flows (4). Below the cards are four analytics panels: Flow Actions donut chart, Protocol Distribution bar chart, Top Destinations ranking, and Top Users by Traffic.
| Card | Description |
|---|---|
| Total Flows | The total number of distinct flows in the selected period. |
| Total Packets | The aggregate packet count. |
| Total Traffic | The total data volume transferred. |
| Allowed Flows | Flows permitted by access policies. Shown in green. |
| Denied Flows | Flows blocked by access policies. Shown in red. |
A Last 24 Hours dropdown in the upper right lets you adjust the time range, and a Refresh button reloads the dashboard data.
Analytics Panels
Flow Actions
A donut chart showing the ratio of allowed vs. denied flows. The center displays the total flow count. The legend below shows the percentage breakdown — in the example, 98.3% Allowed (green) and 1.7% Denied (red). This chart gives you a quick sense of how much traffic your policies are blocking.
Protocol Distribution
A horizontal bar chart breaking down traffic by protocol. Each bar shows the protocol name, flow count, packet count, and byte volume. In the example:
| Protocol | Flows | Packets | Traffic |
|---|---|---|---|
| ICMP | 212 | 5,225 | 428.61 KB |
| TCP | 18 | 441 | 93.51 KB |
| UDP | 4 | 19 | 23.71 KB |
The bar lengths are proportional to the flow count, making it easy to spot which protocols dominate your VPN traffic.
Top Destinations
A ranked list of the most frequently accessed destination IP addresses with their port numbers and protocol. Each entry shows the flow count and total bytes. This helps you understand where your VPN users are connecting and can highlight unexpected or suspicious destinations.
Top Users by Traffic
A ranking of users by data volume consumed through the VPN. When user identity data is available, this panel shows usernames ranked by bytes transferred. If no user identity data is mapped to the flows, the panel displays "No user data available."
Hourly Traffic Distribution
Below the four analytics panels, a time-series chart shows traffic volume distributed across the hours of the day. The x-axis represents hours (0:00 through 24:00) and the y-axis represents traffic volume. This chart helps identify peak usage periods and unusual off-hours activity.
Traffic by VPN Server
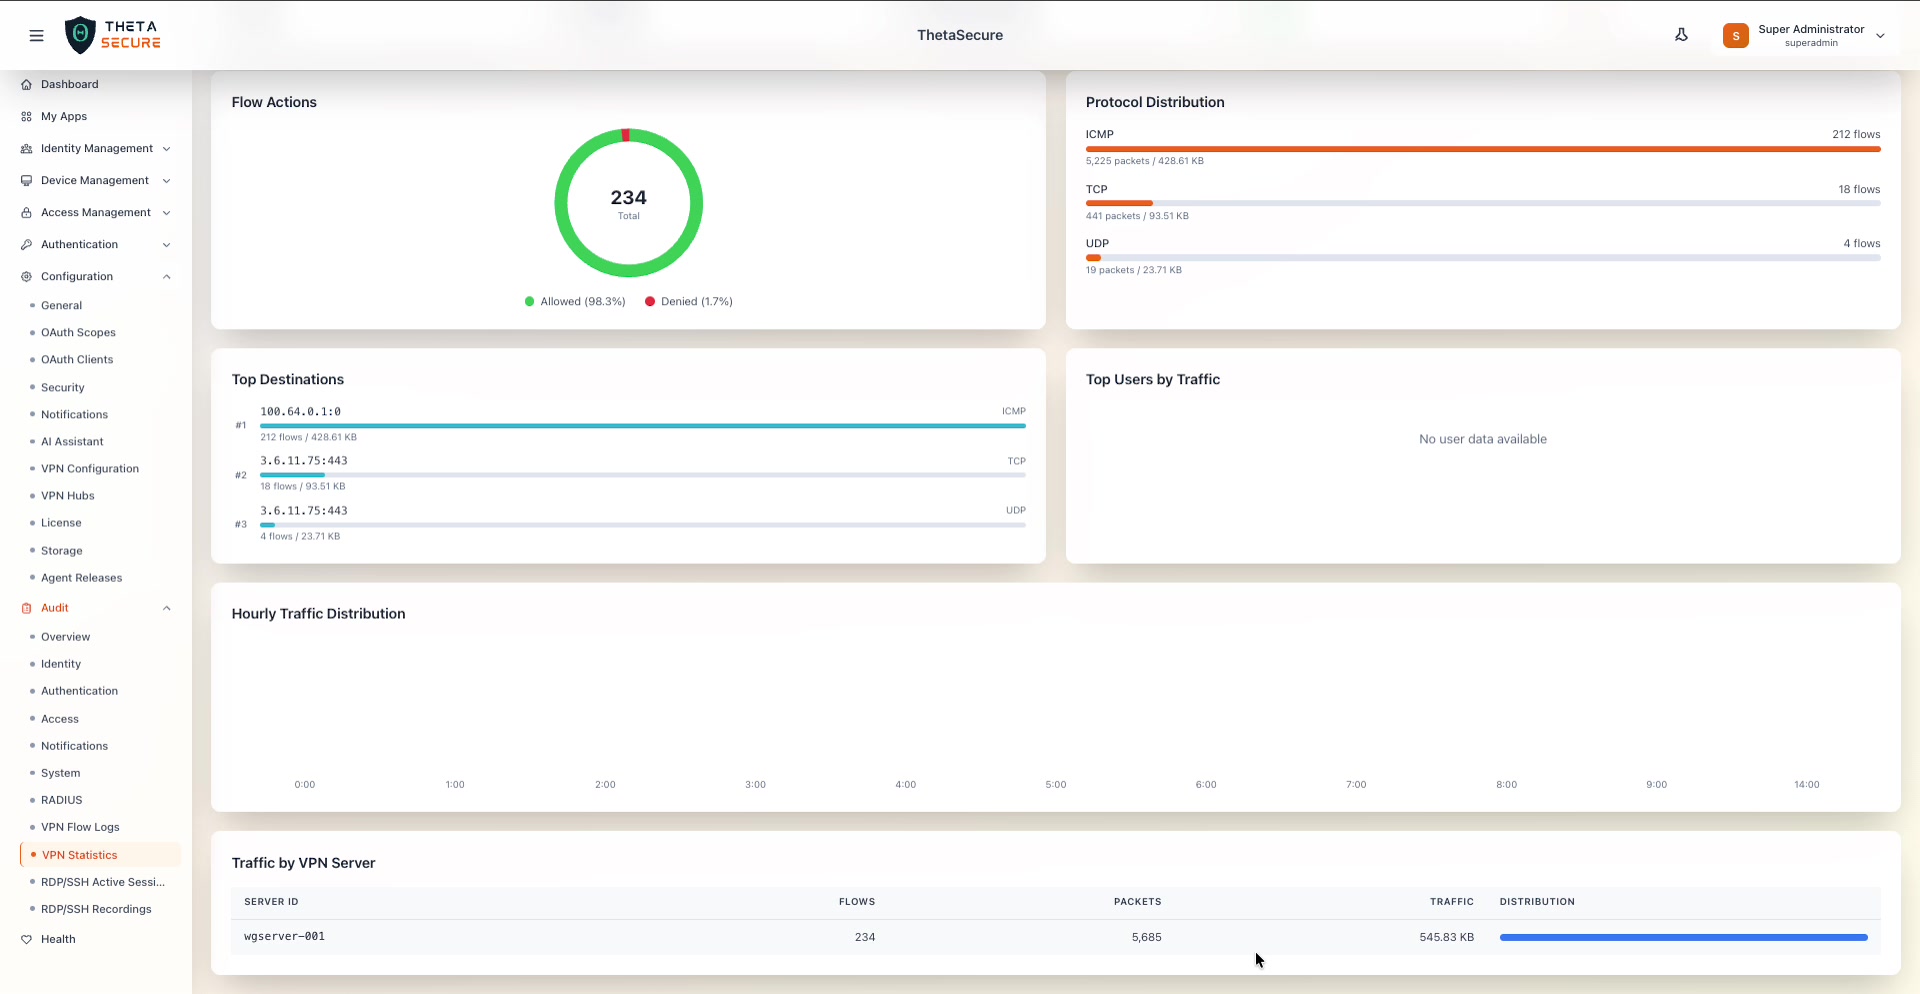 The bottom of the VPN Statistics page showing the Hourly Traffic Distribution time-series chart and the Traffic by VPN Server table. The table lists each WireGuard server with its flow count, packet count, traffic volume, and a distribution bar.
At the bottom of the page, a table breaks down traffic by individual VPN server instance.
| Column | Description |
|---|---|
| Server ID | The WireGuard server identifier (e.g., wgserver-001). |
| Flows | The total number of flows handled by this server. |
| Packets | The total packet count for this server. |
| Traffic | The total bytes transferred through this server. |
| Distribution | A horizontal bar showing this server's share of overall traffic relative to other servers. |
This table is particularly useful in multi-hub VPN deployments where traffic is distributed across multiple WireGuard servers. It helps you identify load imbalances or servers handling disproportionate traffic.
Review the Top Destinations panel regularly to spot unexpected external IPs. A destination that suddenly appears with high flow counts could indicate a compromised endpoint tunneling traffic through the VPN.