System Audit
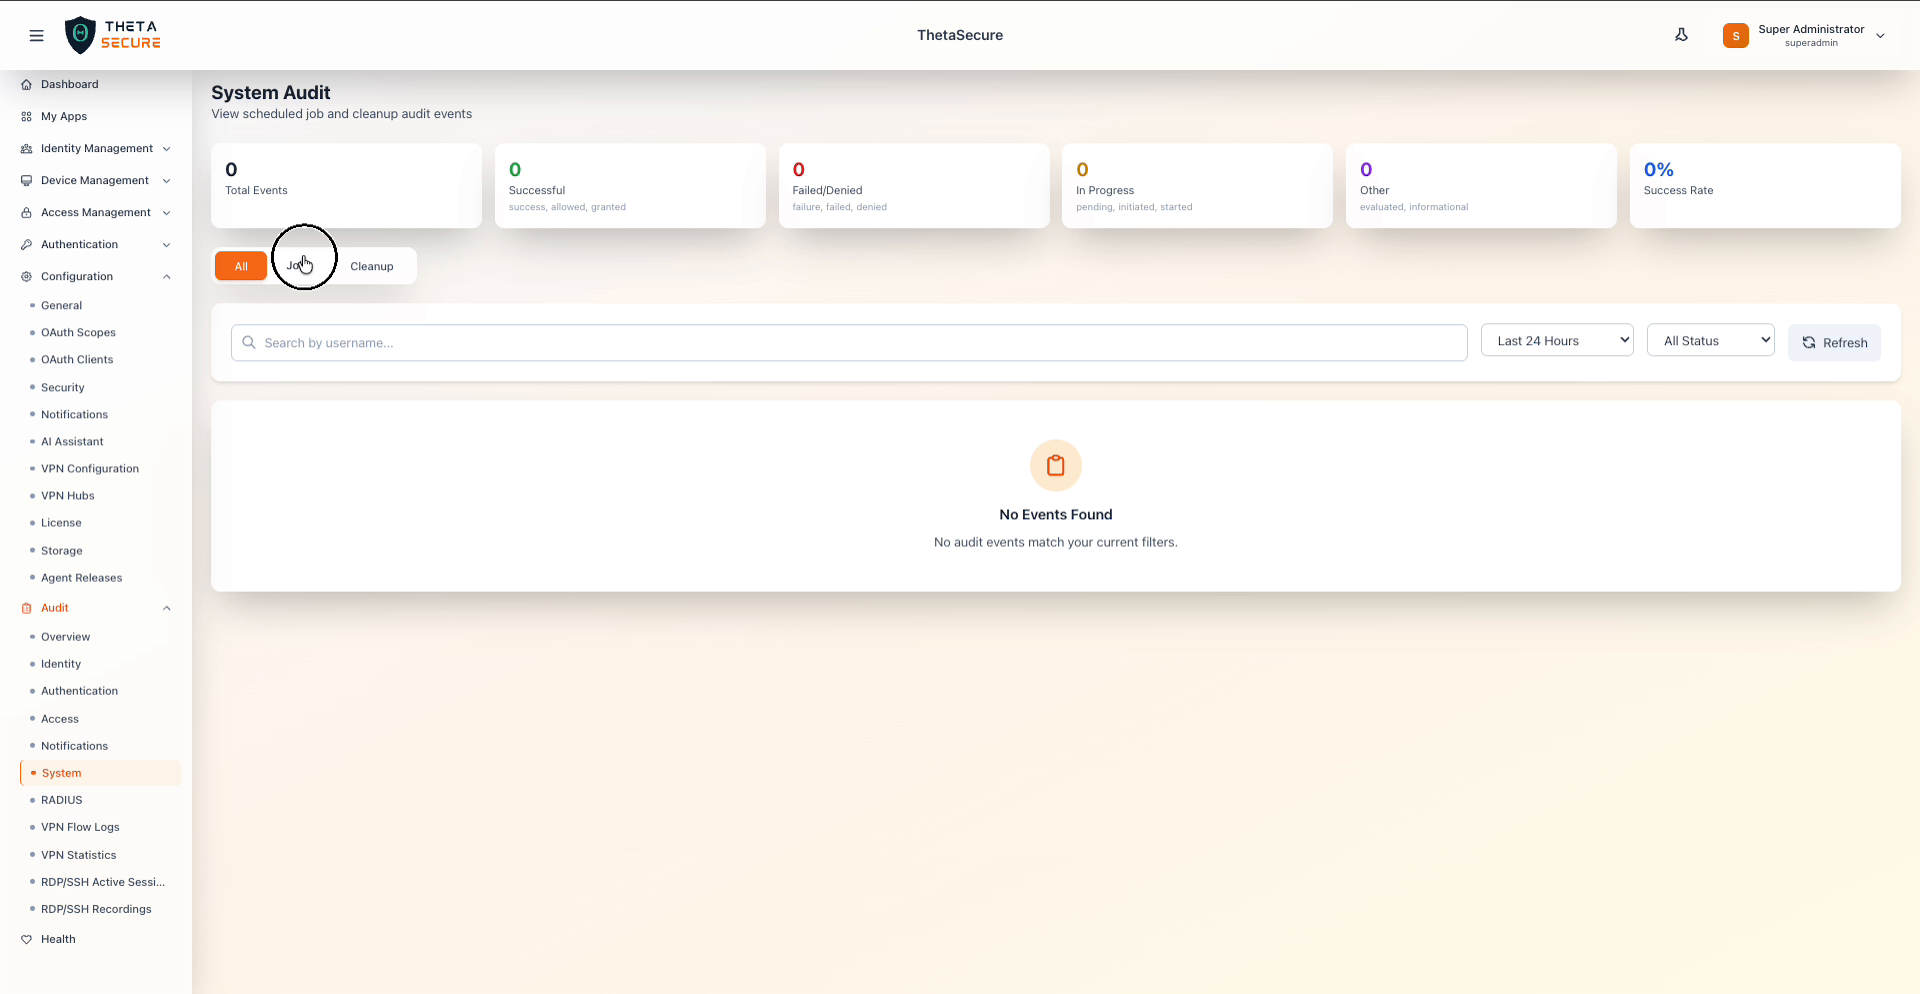
The System Audit page tracks all events related to platform-level system operations — including scheduled jobs and cleanup tasks. Navigate to Audit → System from the sidebar.
Summary Cards
The top of the page displays six summary cards scoped to system events.
| Card | Description |
|---|---|
| Total Events | Total system audit events in the selected time range. |
| Successful | System operations that completed successfully. |
| Failed/Denied | System operations that failed. |
| In Progress | System operations still running. |
| Other | System events with informational or evaluation statuses. |
| Success Rate | Percentage of successful system operations. |
Category Tabs
The System Audit page provides three tabs to filter events by sub-category:
| Tab | Description |
|---|---|
| All | Displays all system events across every sub-category. |
| Jobs | Filters to scheduled job events such as cron jobs, background tasks, and automated workflows. |
| Cleanup | Filters to cleanup events such as data purging, session cleanup, and log rotation tasks. |
The currently active tab is highlighted with an orange background.
Filters and Search
| Control | Description |
|---|---|
| Search by username | Free-text search to filter events by a specific username or system actor. |
| Time Range | Dropdown to select the time window: Last Hour, Last 24 Hours, Last 7 Days, Last 30 Days, Last 90 Days. |
| Status Filter | Dropdown to filter by event status: All Status, Success, Failure, Failed, Allowed, Denied, Granted, Evaluated, Initiated, Started, Pending. |
| Refresh | Button to reload the data with current filters. |
Event Log Table
The event log table displays system events with the standard columns: Time, Category, Event Type, User / Actor, IP Address, Resource, Status, and Details.
Empty State
When no system events match the current filters, a centered message is displayed: "No Events Found" with the subtitle "No audit events match your current filters."